
1. AI-Powered Object Detection & Tracking using Microsoft Azure AI Vision
Description
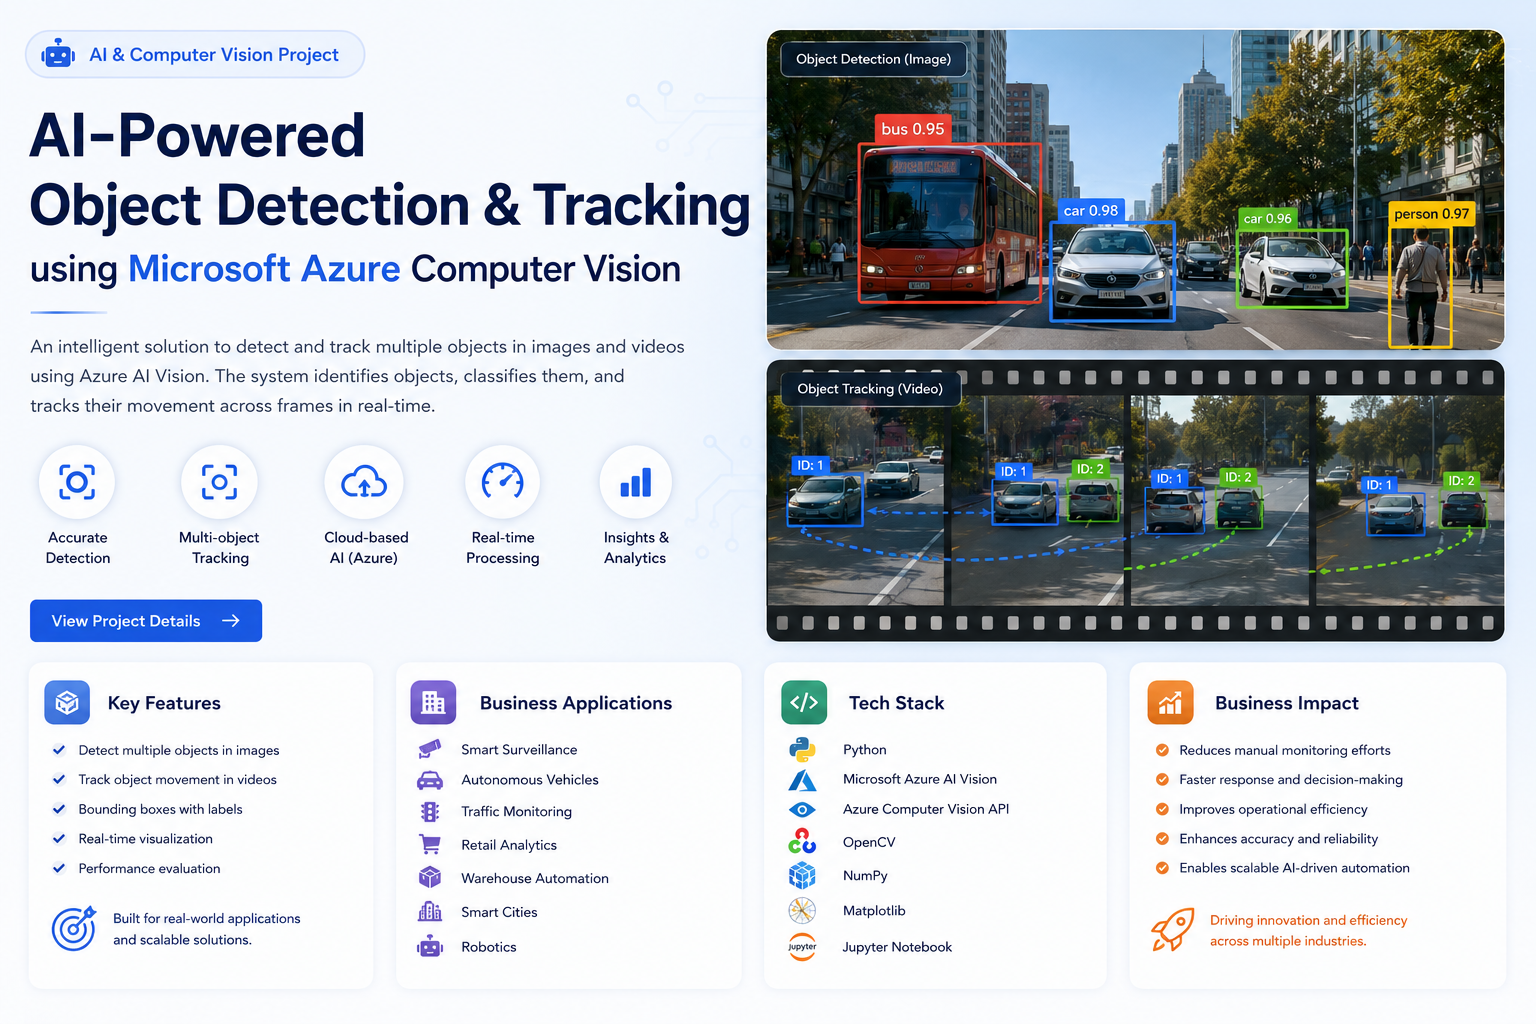
Developed an intelligent computer vision application using Microsoft Azure AI Vision to detect, classify, and track multiple objects in images and videos. The solution generates bounding boxes, labels detected objects, tracks movement across video frames, and evaluates detection performance for real-world AI applications.
Key Features
- Object Detection using Azure AI Vision
- Multi-object Tracking in Video
- Bounding Box & Label Generation
- Real-time Object Movement Visualization
- Performance Evaluation & Model Analysis
Business Impact
Automates visual monitoring by reducing manual inspection efforts, improving operational efficiency, and enabling real-time decision-making for surveillance, traffic monitoring, manufacturing, and smart city applications.
Technologies Used
Python • Microsoft Azure AI Vision • Azure Computer Vision API • OpenCV • NumPy • Matplotlib • Jupyter Notebook
2.AI-Powered Question Answering Chatbot using Microsoft Azure Language Studio
Description
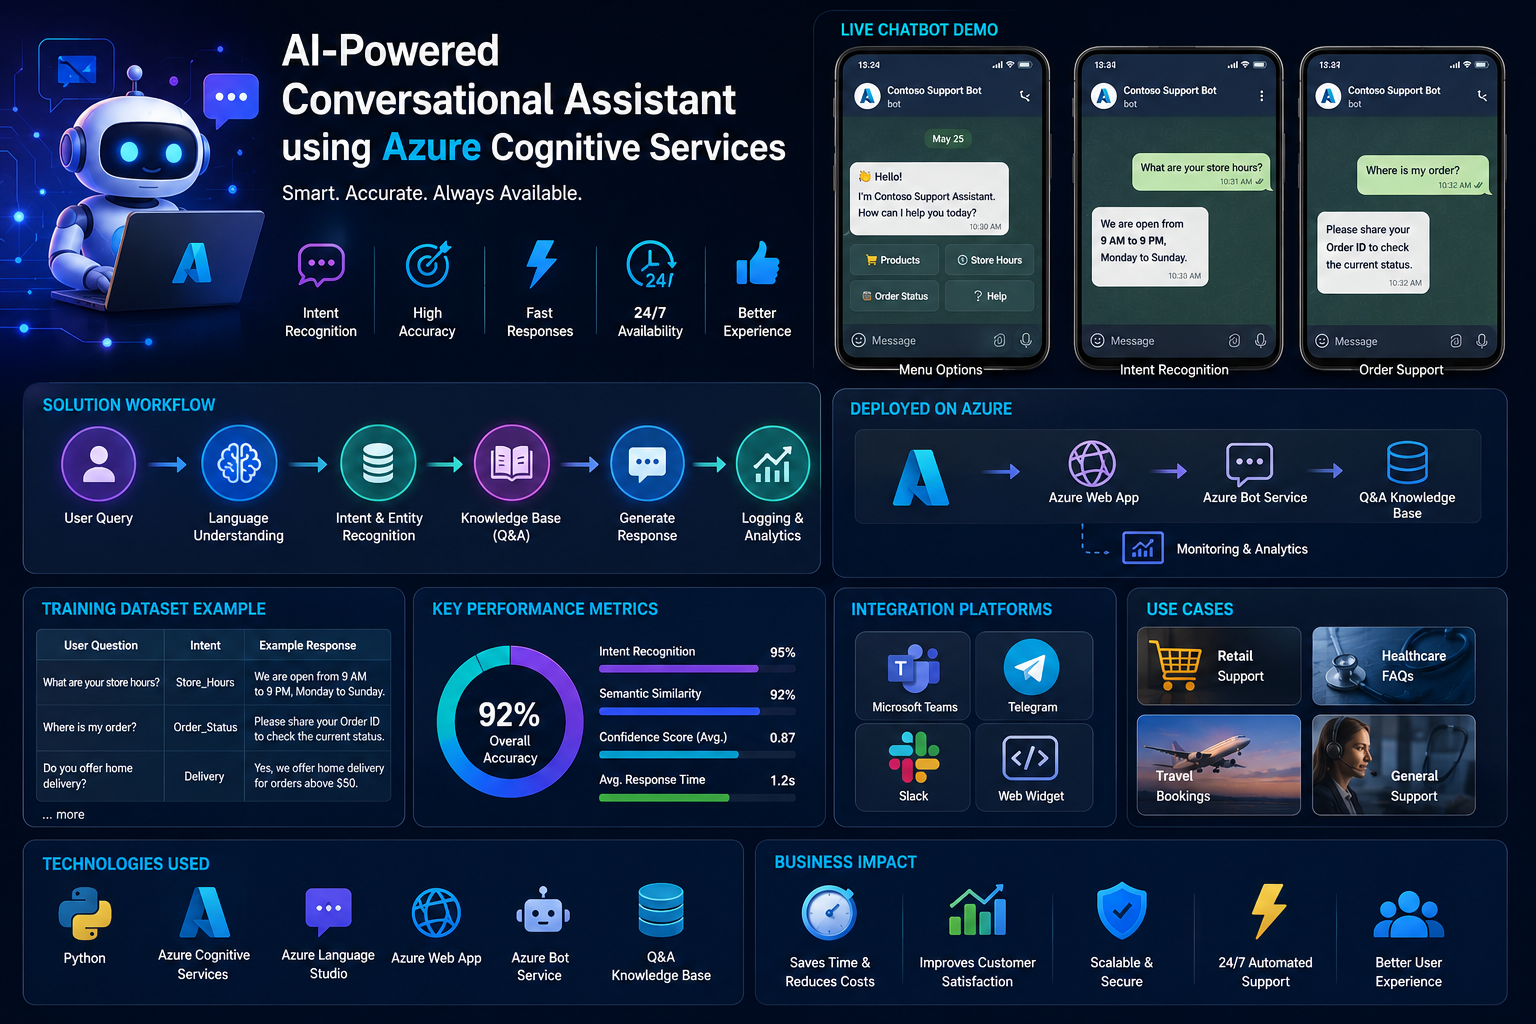
Developed an AI-powered Question Answering chatbot using Microsoft Azure Language Studio to understand natural language queries and deliver accurate, context-aware responses. The solution was trained on a custom knowledge base, deployed as a cloud-based chatbot, and evaluated for response accuracy across multiple user scenarios.
Key Features
- Custom Knowledge Base Creation
- Natural Language Understanding (NLU)
- AI-Powered Question Answering
- Azure Language Studio Integration
- Cloud Deployment & Chatbot Testing
- Response Accuracy Evaluation
Business Impact
Automates customer support by providing instant, accurate responses to frequently asked questions, reducing support workload, improving customer experience, and enabling scalable AI-driven assistance across industries such as retail, healthcare, and travel.
Technologies Used
Python • Microsoft Azure Language Studio • Azure AI Language • Azure Cognitive Services • Azure Web App • REST APIs • Jupyter Notebook
3. Conversational Language Understanding (CLU) using Microsoft Azure AI Language
Description
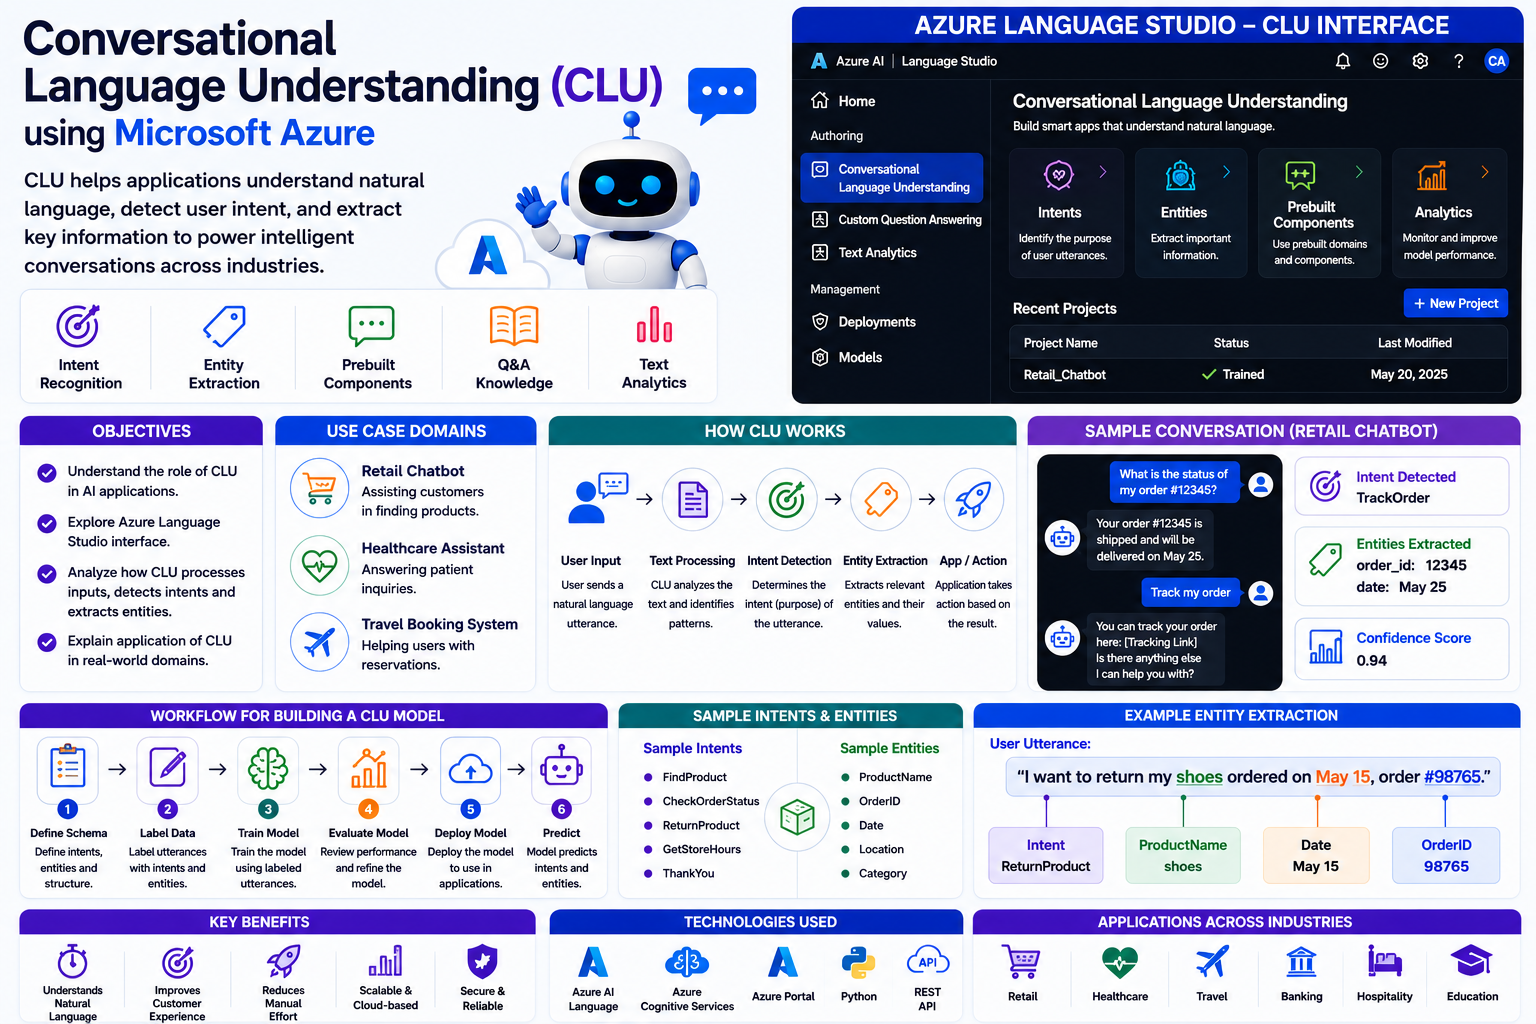
Designed and configured a Conversational Language Understanding (CLU) solution using Microsoft Azure AI Language Studio to recognize user intents and extract entities from natural language conversations. This project demonstrates how intelligent NLP applications can be built using Azure’s low-code/no-code AI services, without developing or training custom machine learning models in code. The solution showcases how Azure AI accelerates the development of conversational applications for domains such as retail, healthcare, and travel.
Key Features
- Low-Code/No-Code AI Development
- Conversational Language Understanding (CLU)
- Intent Recognition
- Entity Extraction
- Natural Language Processing (NLP)
- Azure Language Studio Configuration
- AI Solution Design & Evaluation
Business Impact
Enables organizations to rapidly develop intelligent conversational AI applications without extensive programming or machine learning expertise. By leveraging Azure’s managed AI services, businesses can automate customer interactions, improve response accuracy, reduce development time, and accelerate AI adoption.
Technologies Used
Microsoft Azure AI Language • Azure Language Studio • Conversational Language Understanding (CLU) • Natural Language Processing (NLP) • Azure Cognitive Services • Low-Code/No-Code AI Platform
4. AI-Powered Intelligent Smartphone Recommendation Bot using Machine Learning & Microsoft Azure
Description
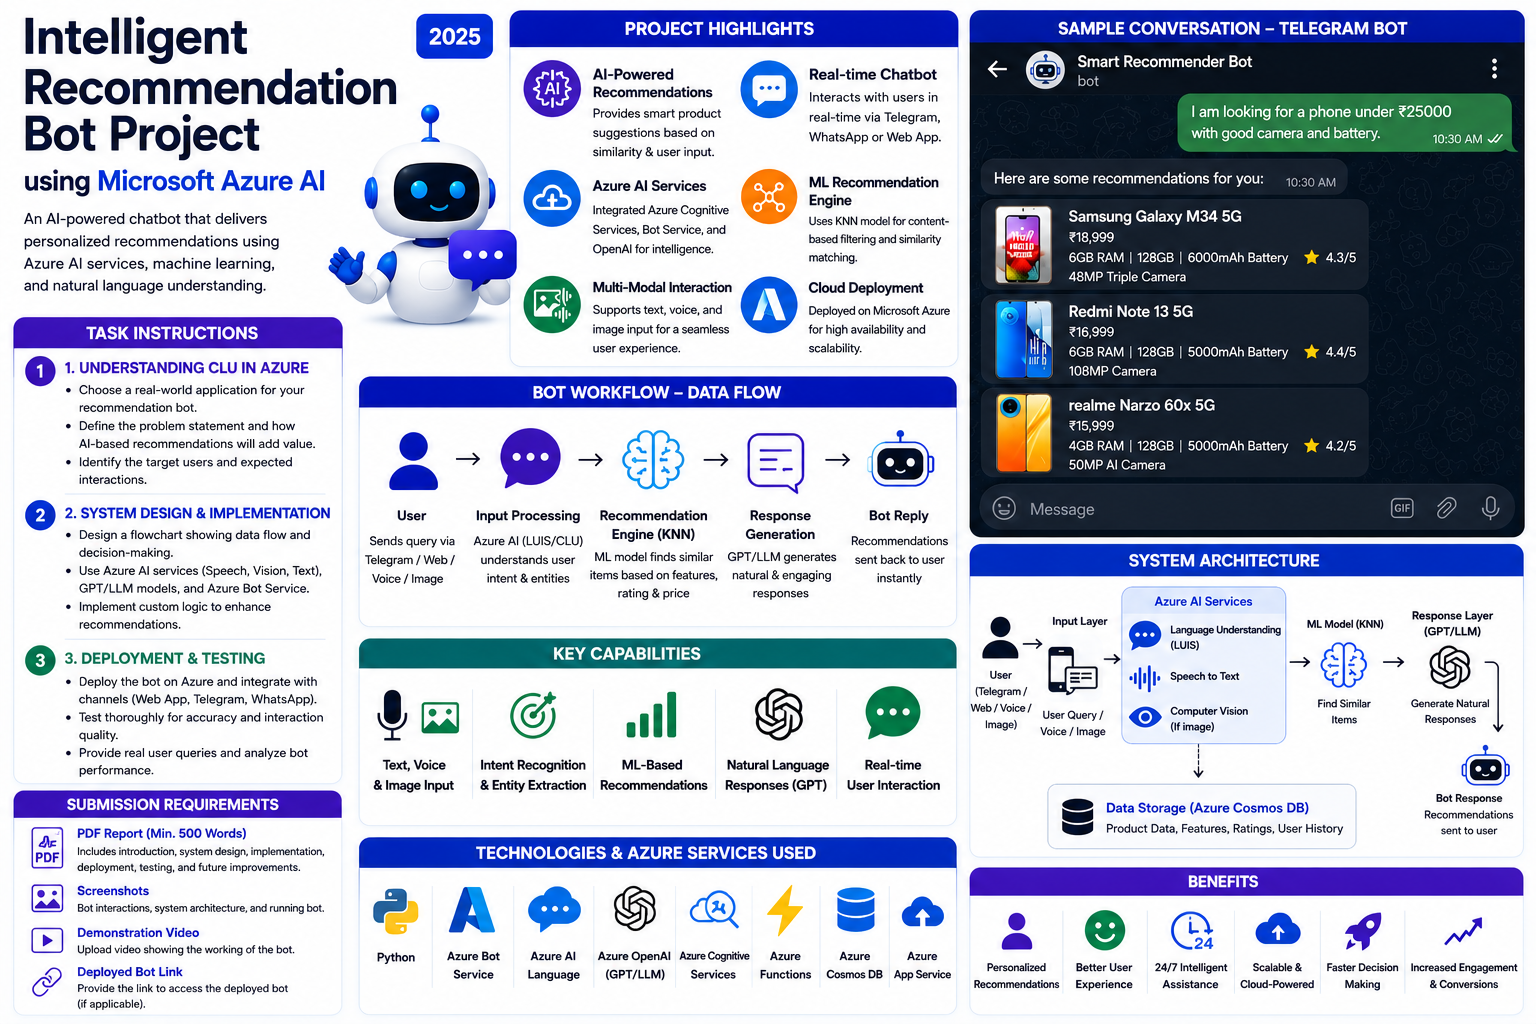
Designed and developed an end-to-end AI-powered recommendation system that suggests smartphones based on user preferences using machine learning and cloud technologies. The project involved web scraping product data from Flipkart, preprocessing and feature engineering, training a K-Nearest Neighbors (KNN) recommendation model, deploying the solution on Microsoft Azure, and integrating it with a Telegram chatbot to deliver real-time personalized recommendations through a conversational interface.
Key Features
- Web Scraping & Automated Data Collection
- Data Cleaning, Feature Engineering & Preprocessing
- KNN-Based Recommendation Engine
- Content-Based Product Recommendation
- Azure Cloud Deployment
- Telegram Chatbot Integration
- Real-Time Personalized Recommendations
- End-to-End ML Pipeline
Business Impact
Provides an intelligent shopping assistant that reduces product search time and improves customer decision-making by delivering personalized smartphone recommendations based on technical specifications, budget, and user preferences. The solution demonstrates how machine learning, cloud deployment, and conversational AI can be combined to enhance customer engagement and e-commerce experiences.
Technologies Used
Python • BeautifulSoup • Selenium • Pandas • NumPy • Scikit-learn • K-Nearest Neighbors (KNN) • Microsoft Azure • Azure Bot Service • Telegram Bot API • Joblib • VS Code
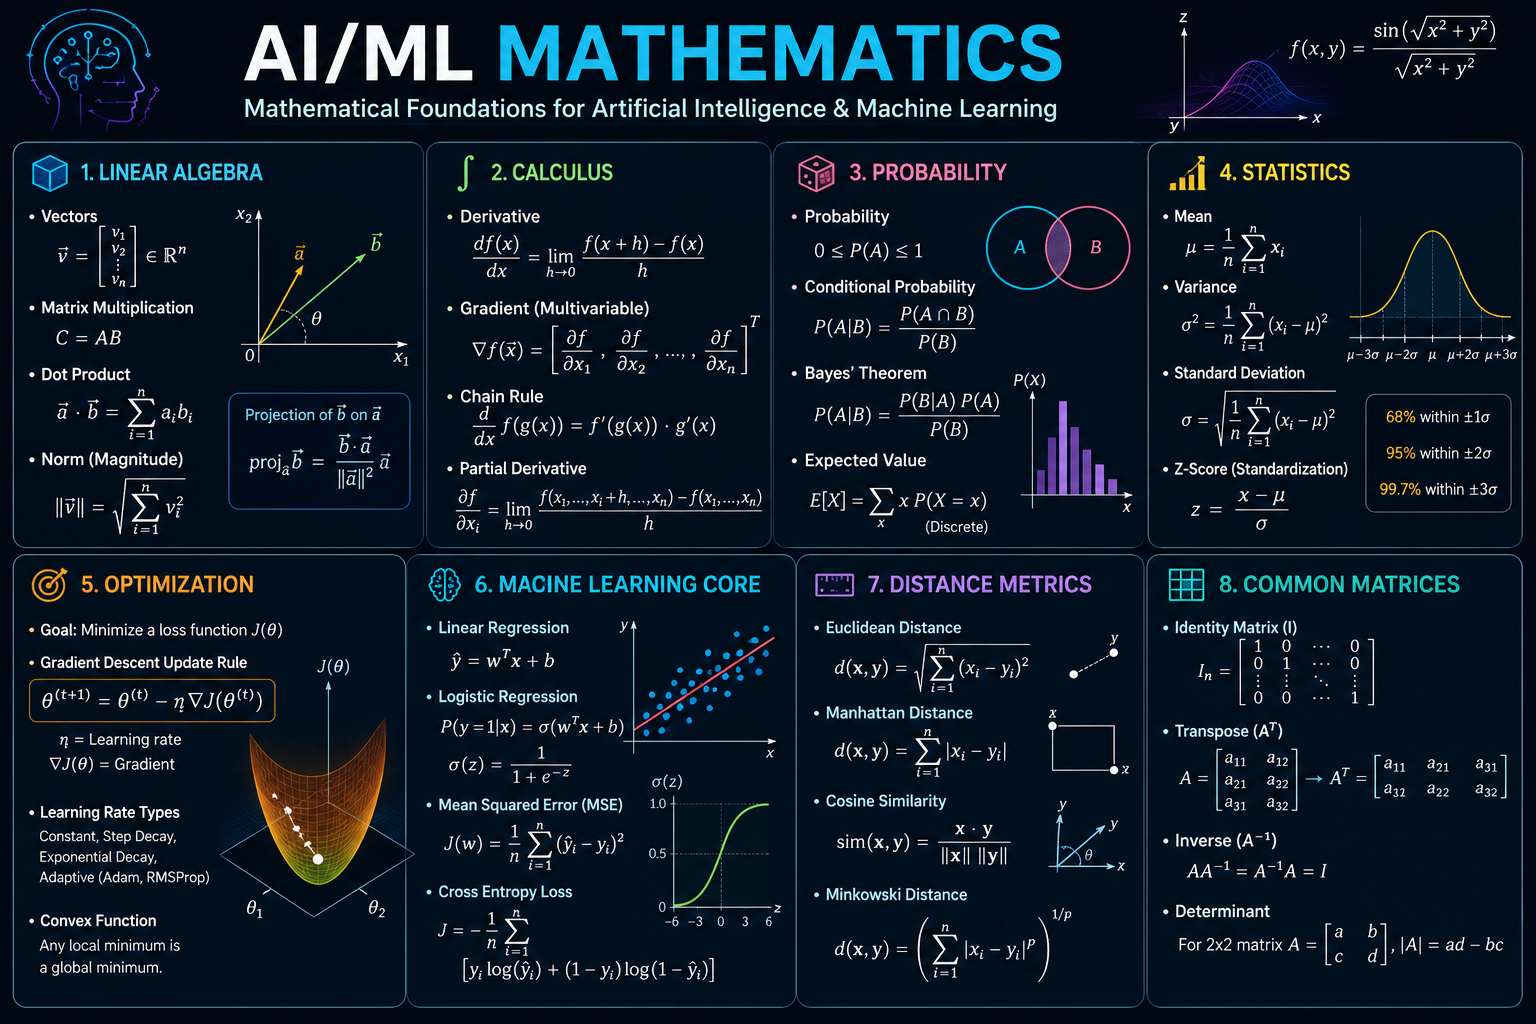
5. Foundations of AI: Mathematical Modeling, Linear Algebra & Graph Theory
Description
Applied core mathematical concepts that underpin modern Artificial Intelligence and Machine Learning, including optimization, Singular Value Decomposition (SVD), graph theory, and probability. The project demonstrates how these mathematical foundations support dimensionality reduction, recommendation systems, spectral clustering, and machine learning optimization.
Key Topics
- Mathematical Optimization & Piecewise Functions
- Singular Value Decomposition (SVD)
- Matrix Factorization & Eigenvalue Analysis
- Graph Theory & Laplacian Matrices
- Probability & Mutual Information
- Linear Algebra for AI
Business Impact
Provides the mathematical foundation required to design robust AI models, optimize machine learning algorithms, analyze complex networks, and develop scalable recommendation and graph-based learning systems.
Technologies & Concepts
Linear Algebra • Calculus • Graph Theory • Probability & Statistics • Matrix Factorization • Spectral Analysis • Optimization • Information Theory
Advance Machine Learning
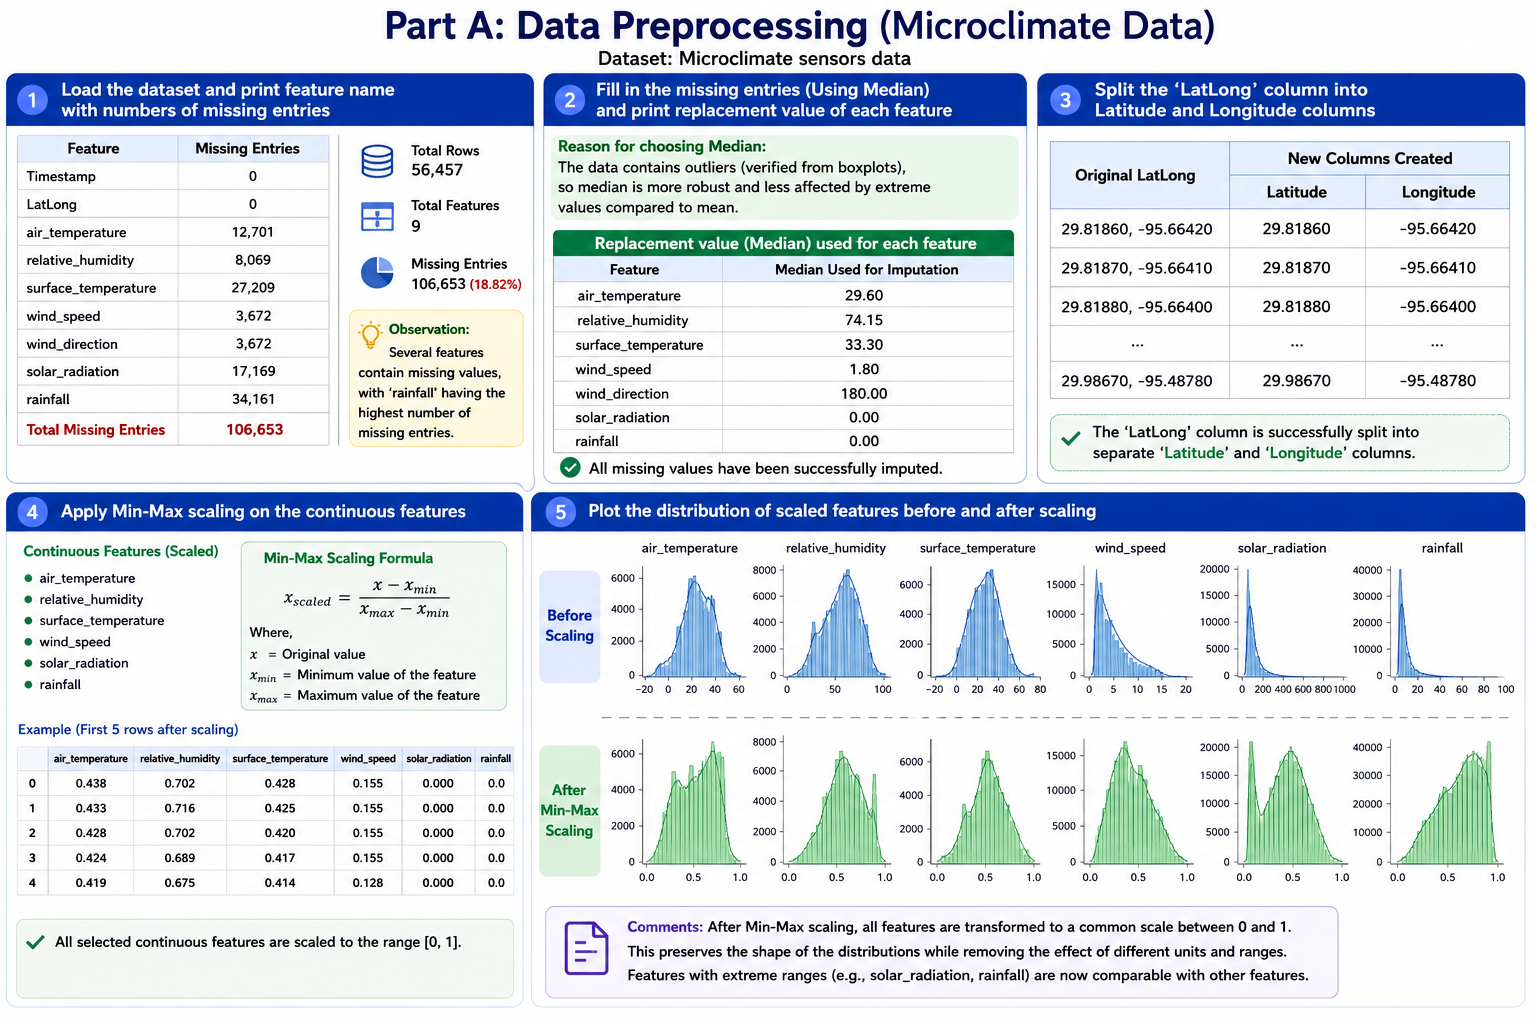
6. Melbourne Urban Microclimate Data Preprocessing & Environmental Analytics
Description
Performed end-to-end preprocessing and feature engineering on Melbourne’s urban microclimate sensor dataset to improve data quality for environmental analytics and machine learning. The project involved missing value imputation, geospatial coordinate extraction, feature scaling, and visualization of sensor data distributions to prepare the dataset for predictive climate and smart city applications.
Key Features
- Missing Value Analysis & Imputation
- Latitude & Longitude Feature Extraction
- Data Cleaning & Transformation
- Min-Max Feature Scaling
- Exploratory Data Analysis (EDA)
- Distribution Visualization
- Data Preparation for Machine Learning
Business Impact
Improves the quality and reliability of environmental sensor data, enabling accurate climate monitoring, urban heat analysis, air quality studies, and AI-driven smart city decision-making.
Technologies Used
Python • Pandas • NumPy • Scikit-learn • Matplotlib • Seaborn • Jupyter Notebook
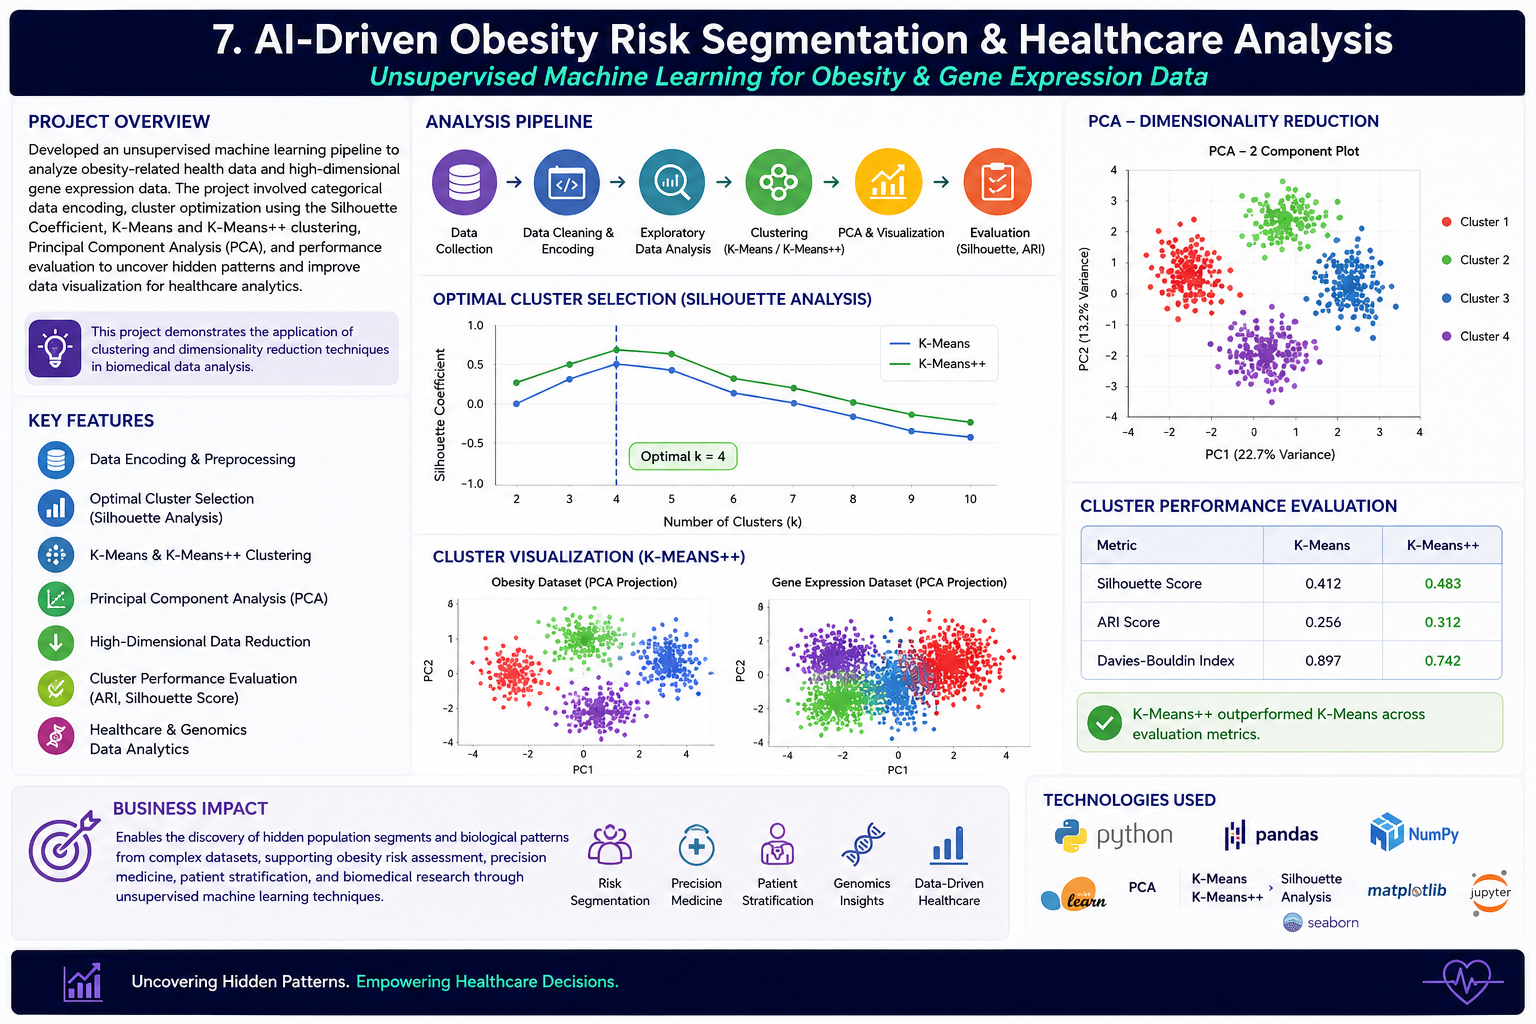
7. AI-Driven Obesity Risk Segmentation & Healthcare Analysis
Description
Developed an unsupervised machine learning pipeline to analyze obesity-related health data and high-dimensional gene expression data. The project involved categorical data encoding, cluster optimization using the Silhouette Coefficient, K-Means and K-Means++ clustering, Principal Component Analysis (PCA), and performance evaluation to uncover hidden patterns and improve data visualization for healthcare analytics. This project demonstrates the application of clustering and dimensionality reduction techniques in biomedical data analysis. (If your notebook also evaluates clustering using ARI or other metrics, that strengthens the project further.)
Key Features
- Data Encoding & Preprocessing
- Optimal Cluster Selection (Silhouette Analysis)
- K-Means & K-Means++ Clustering
- Principal Component Analysis (PCA)
- High-Dimensional Data Reduction
- Cluster Performance Evaluation
- Healthcare & Genomics Data Analytics
Business Impact
Enables the discovery of hidden population segments and biological patterns from complex datasets, supporting obesity risk assessment, precision medicine, patient stratification, and biomedical research through unsupervised machine learning techniques.
Technologies Used
Python • Pandas • NumPy • Scikit-learn • PCA • K-Means • K-Means++ • Silhouette Analysis • Matplotlib • Seaborn • Jupyter Notebook
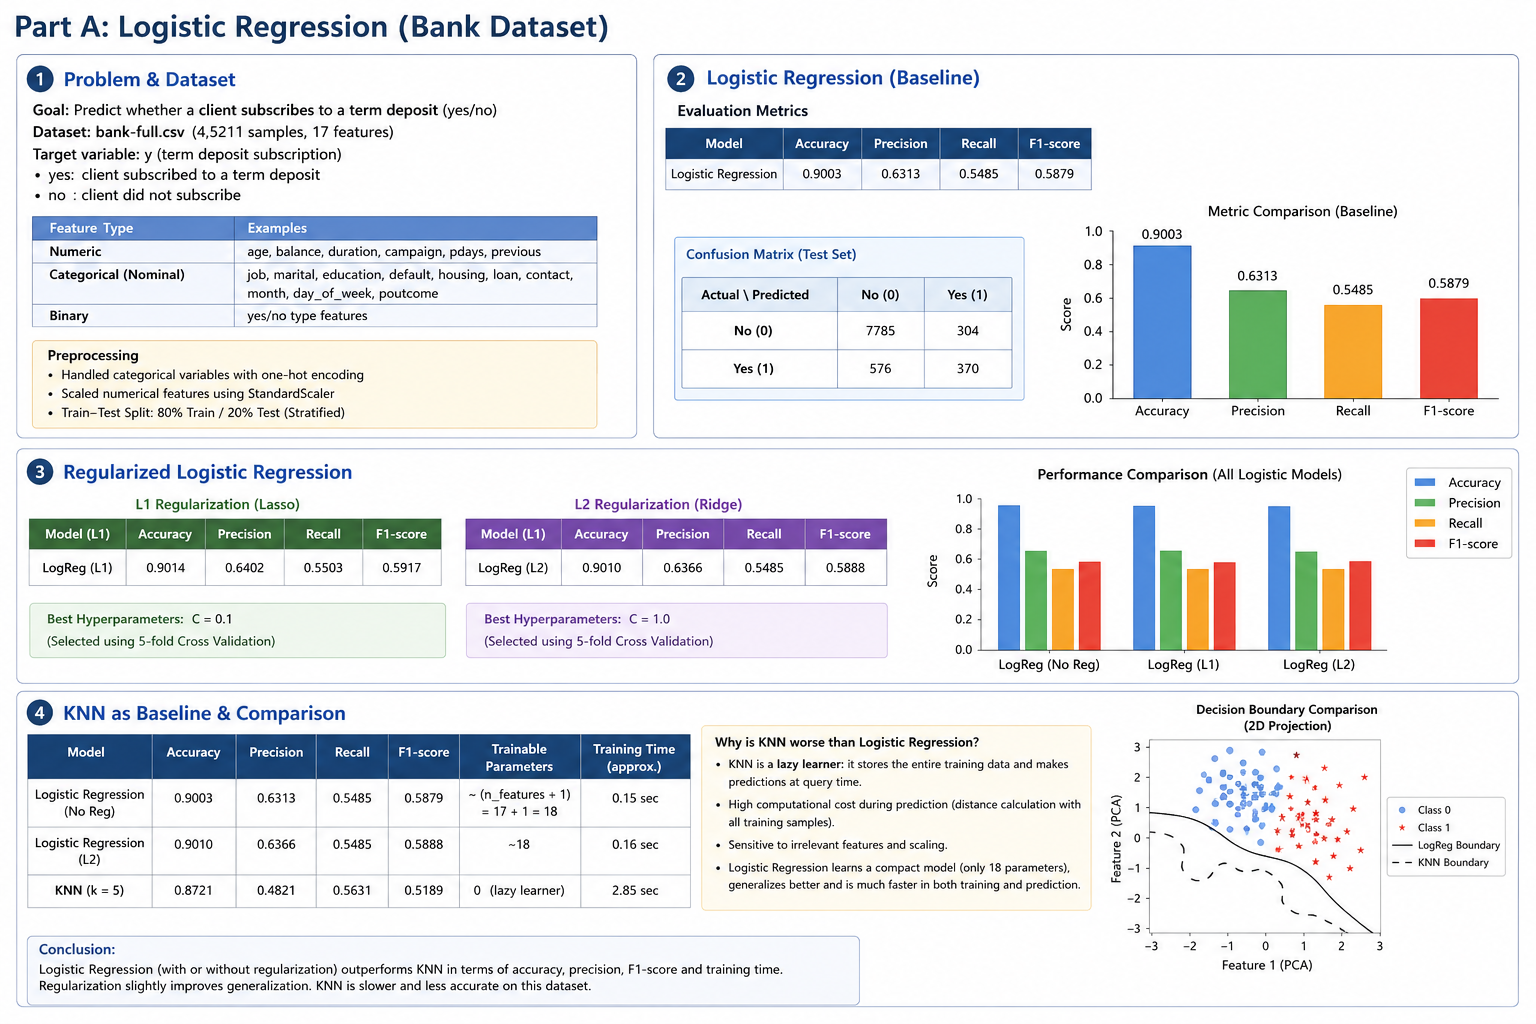
8.Bank Term Deposit Subscription Prediction using Logistic Regression
Description
Developed a machine learning classification model to predict whether a bank customer is likely to subscribe to a term deposit using historical marketing campaign data. The project involved data preprocessing, feature encoding, model training, performance evaluation, and comparison of Logistic Regression, Regularized Logistic Regression (L1 & L2), and K-Nearest Neighbors (KNN) to identify the most effective predictive model for customer response analysis.
Key Features
- Data Preprocessing & Feature Encoding
- Binary Classification using Logistic Regression
- L1 (Lasso) & L2 (Ridge) Regularization
- K-Nearest Neighbors (KNN) Baseline Comparison
- Model Performance Evaluation
- Precision, Recall, F1-Score & Accuracy Analysis
Business Impact
Helps financial institutions identify customers with a higher likelihood of subscribing to term deposits, enabling targeted marketing campaigns, improving conversion rates, reducing marketing costs, and supporting data-driven customer relationship management.
Technologies Used
Python • Pandas • NumPy • Scikit-learn • Logistic Regression • KNN • Matplotlib • Seaborn • Jupyter Notebook
9. Electrical Grid Stability Prediction using Support Vector Machines (SVM)
Description
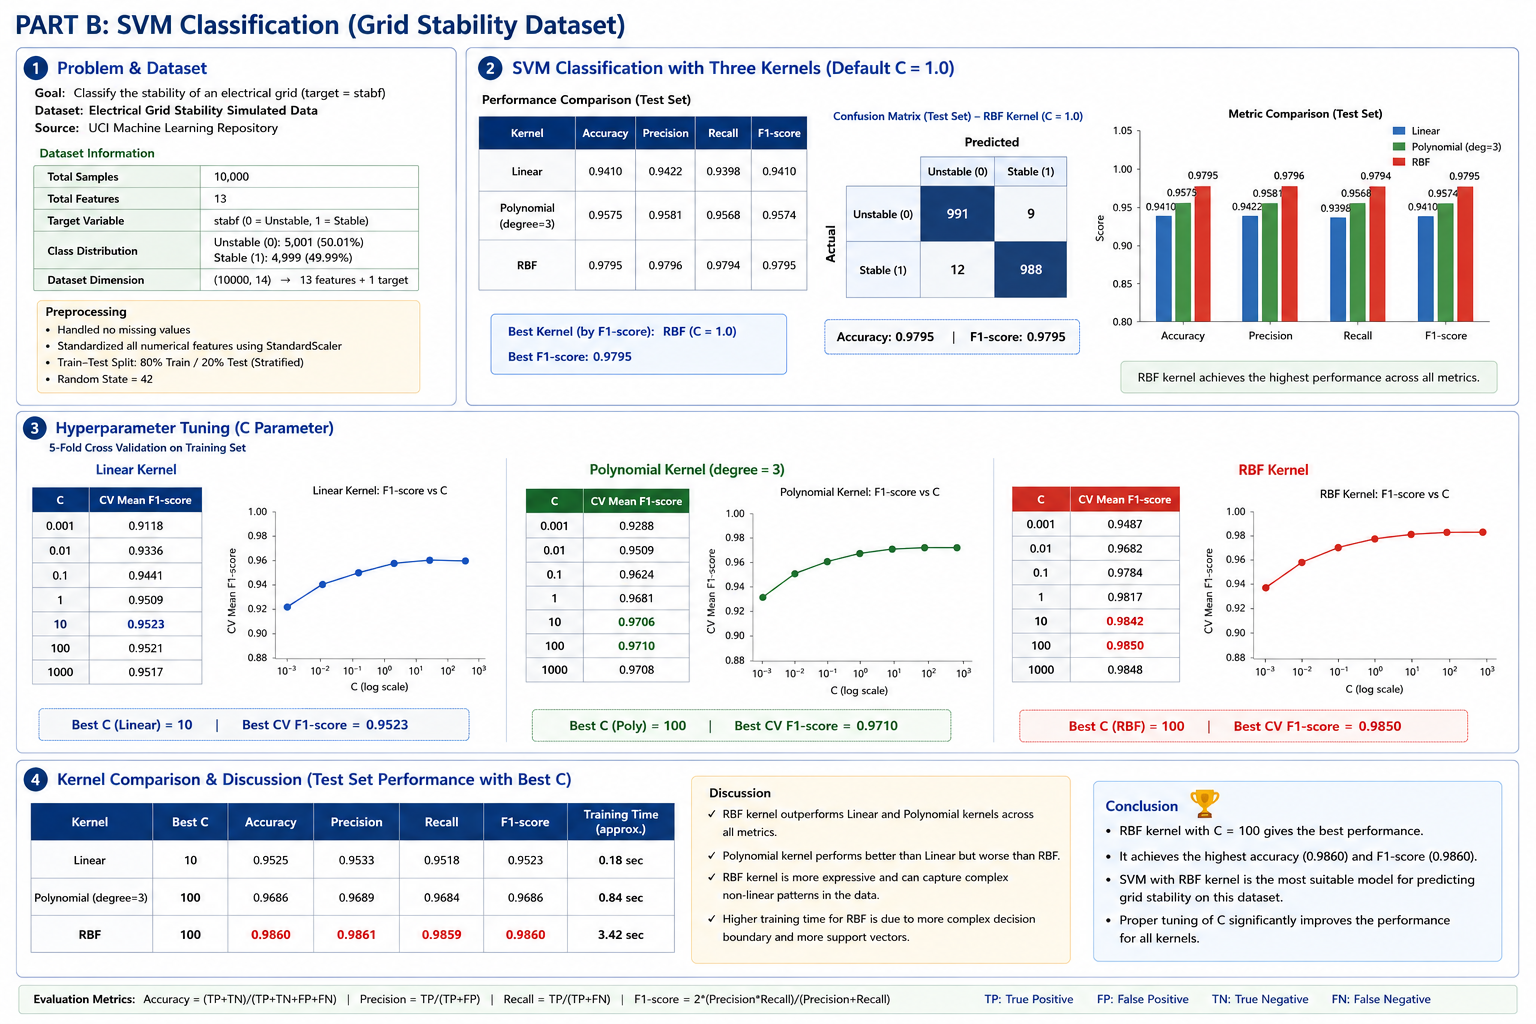
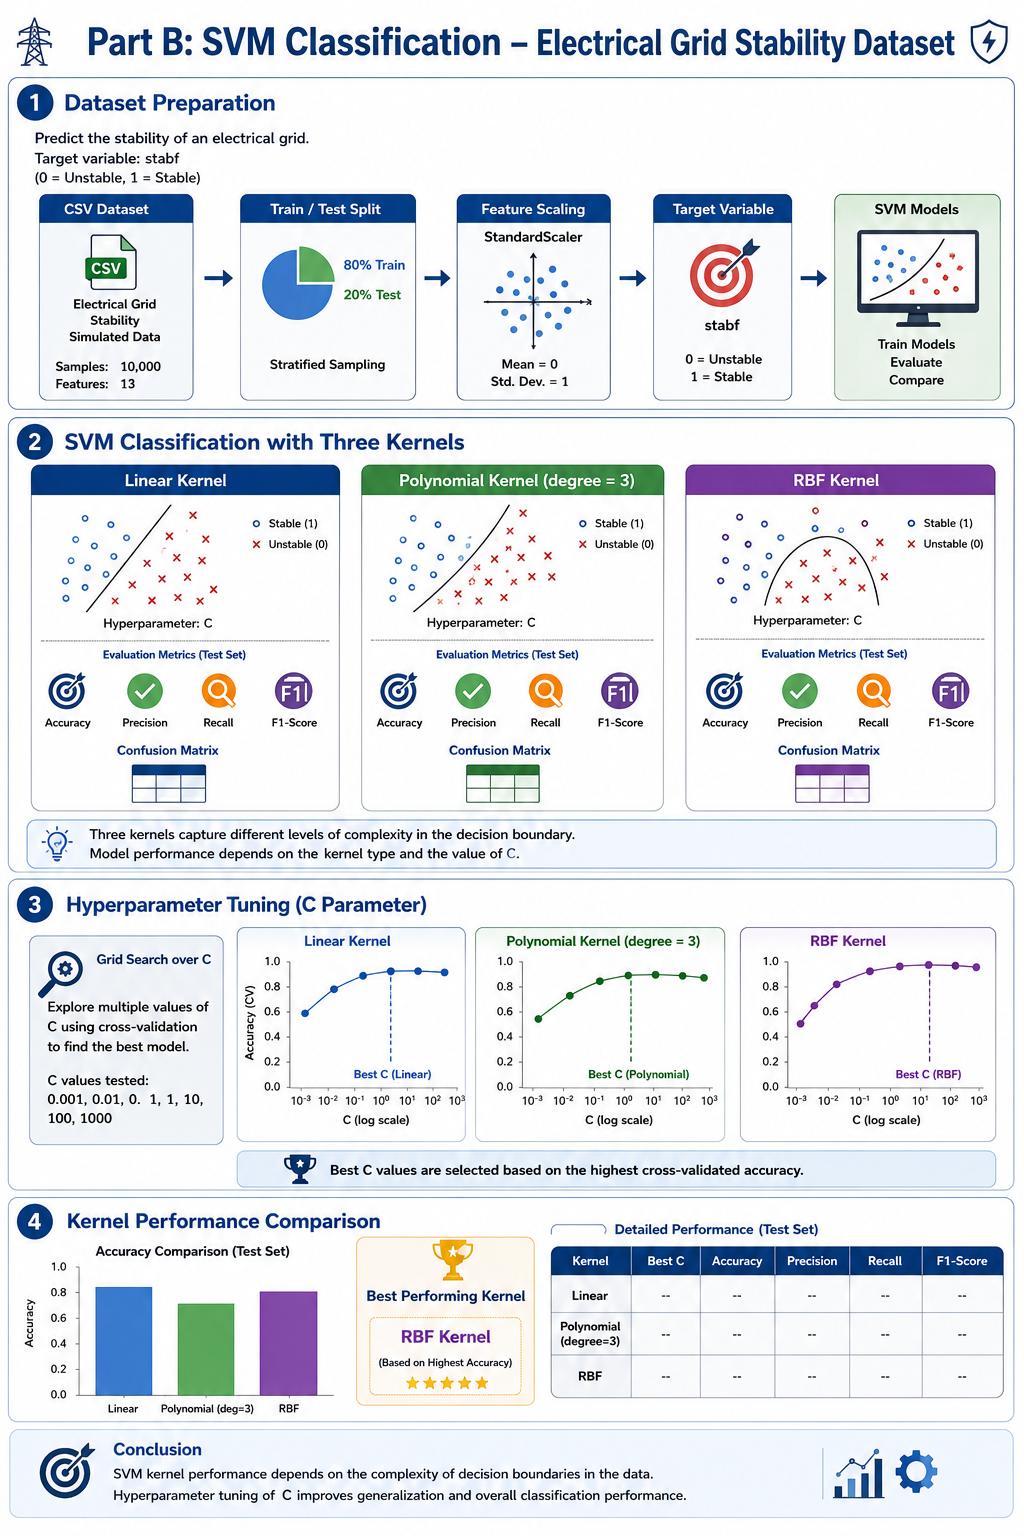
Developed a machine learning classification model to predict the stability of electrical power grids using the Electrical Grid Stability Simulated Dataset. The project involved training and evaluating Support Vector Machine (SVM) models with multiple kernel functions, tuning hyperparameters to optimize classification performance, and comparing different kernel approaches to identify the most effective model for power system stability prediction.
Key Features
- Electrical Grid Stability Classification
- Support Vector Machine (SVM)
- Linear, Polynomial & RBF Kernel Comparison
- Hyperparameter Tuning (C Parameter)
- Model Performance Evaluation
- Accuracy, Precision, Recall & F1-Score Analysis
Business Impact
Supports smart grid operations by accurately predicting power system stability, enabling early detection of unstable conditions, improving grid reliability, reducing operational risks, and assisting utility providers in maintaining a resilient and efficient electrical infrastructure.
Technologies Used
Python • Pandas • NumPy • Scikit-learn • Support Vector Machine (SVM) • Hyperparameter Tuning • Matplotlib • Seaborn • Jupyter Notebook
10.Handwritten Digit Recognition using Deep Neural Networks (MNIST)
Description
Developed and evaluated Multi-Layer Perceptron (MLP) models for handwritten digit recognition using the MNIST dataset. The project included comprehensive exploratory data analysis, image preprocessing, neural network architecture design, hyperparameter experimentation, and performance evaluation. Different network depths and hidden layer sizes were analyzed to study their impact on classification accuracy, training efficiency, and generalization. The project also reproduced the Double Descent phenomenon to demonstrate how neural network capacity influences model performance.
Key Features
- Image Data Preprocessing & Normalization
- Exploratory Data Analysis (EDA)
- Multi-Layer Perceptron (MLP) Classification
- Hidden Layer Depth & Width Optimization
- Deep Learning Performance Analysis
- Double Descent Risk Curve Reproduction
- Training & Validation Performance Evaluation
Business Impact
Demonstrates how deep neural networks can accurately classify handwritten images while analyzing the trade-offs between model complexity, accuracy, and computational cost. The techniques explored are directly applicable to optical character recognition (OCR), document digitization, postal automation, banking cheque processing, and intelligent document analysis.
Technologies Used
Python • TensorFlow • Keras • NumPy • Pandas • Matplotlib • Seaborn • Scikit-learn • Jupyter Notebook
11. AI-Based Liver Cirrhosis Survival Prediction using Machine Learning
Description
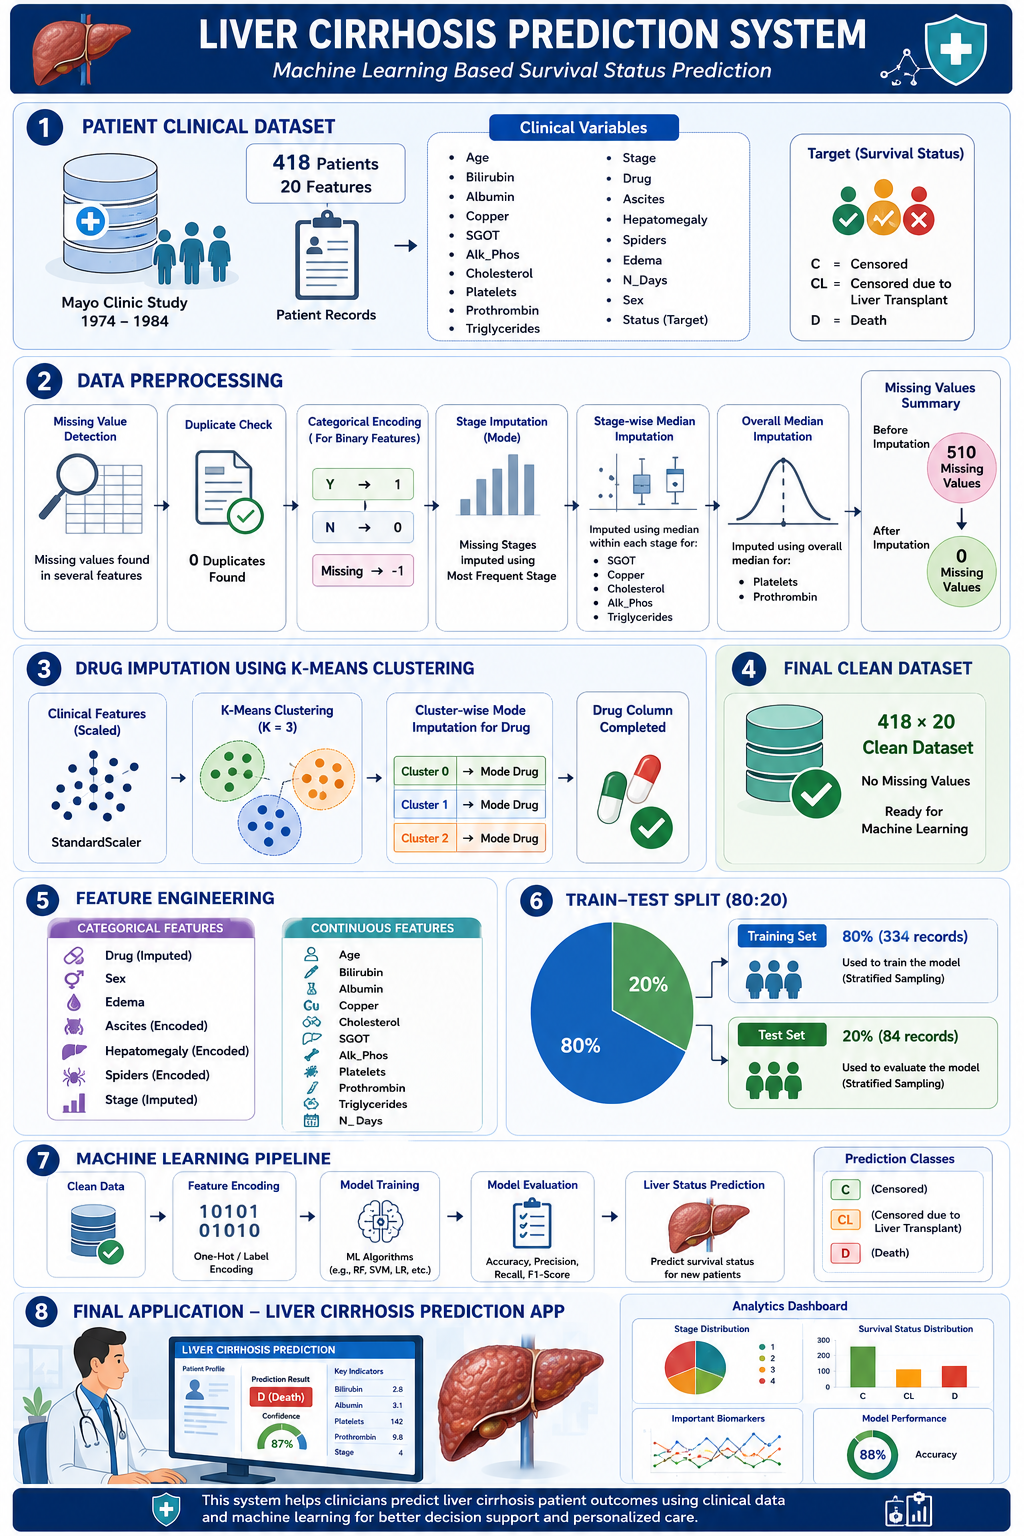
Developed an end-to-end machine learning solution to predict liver cirrhosis survival outcomes using real-world clinical data. The project involved data preprocessing, feature engineering, class imbalance handling, supervised model comparison, hyperparameter tuning, and explainable AI to support accurate and interpretable healthcare predictions.
Key Features
- Clinical Data Preprocessing & EDA
- Missing Value Imputation
- Feature Engineering & Encoding
- Multi-Class Classification
- SMOTE for Class Balancing
- Hyperparameter Optimization
- Feature Importance Analysis
- Model Performance Evaluation
Business Impact
Demonstrates how machine learning can assist clinicians in predicting patient survival, identifying high-risk cases, and supporting data-driven healthcare decisions through interpretable AI models.
Technologies Used
Python • Pandas • NumPy • Scikit-learn • XGBoost • SMOTE • Matplotlib • Seaborn • Jupyter Notebook
12.Predictive Modeling for Melbourne Housing Market Analysis
Description
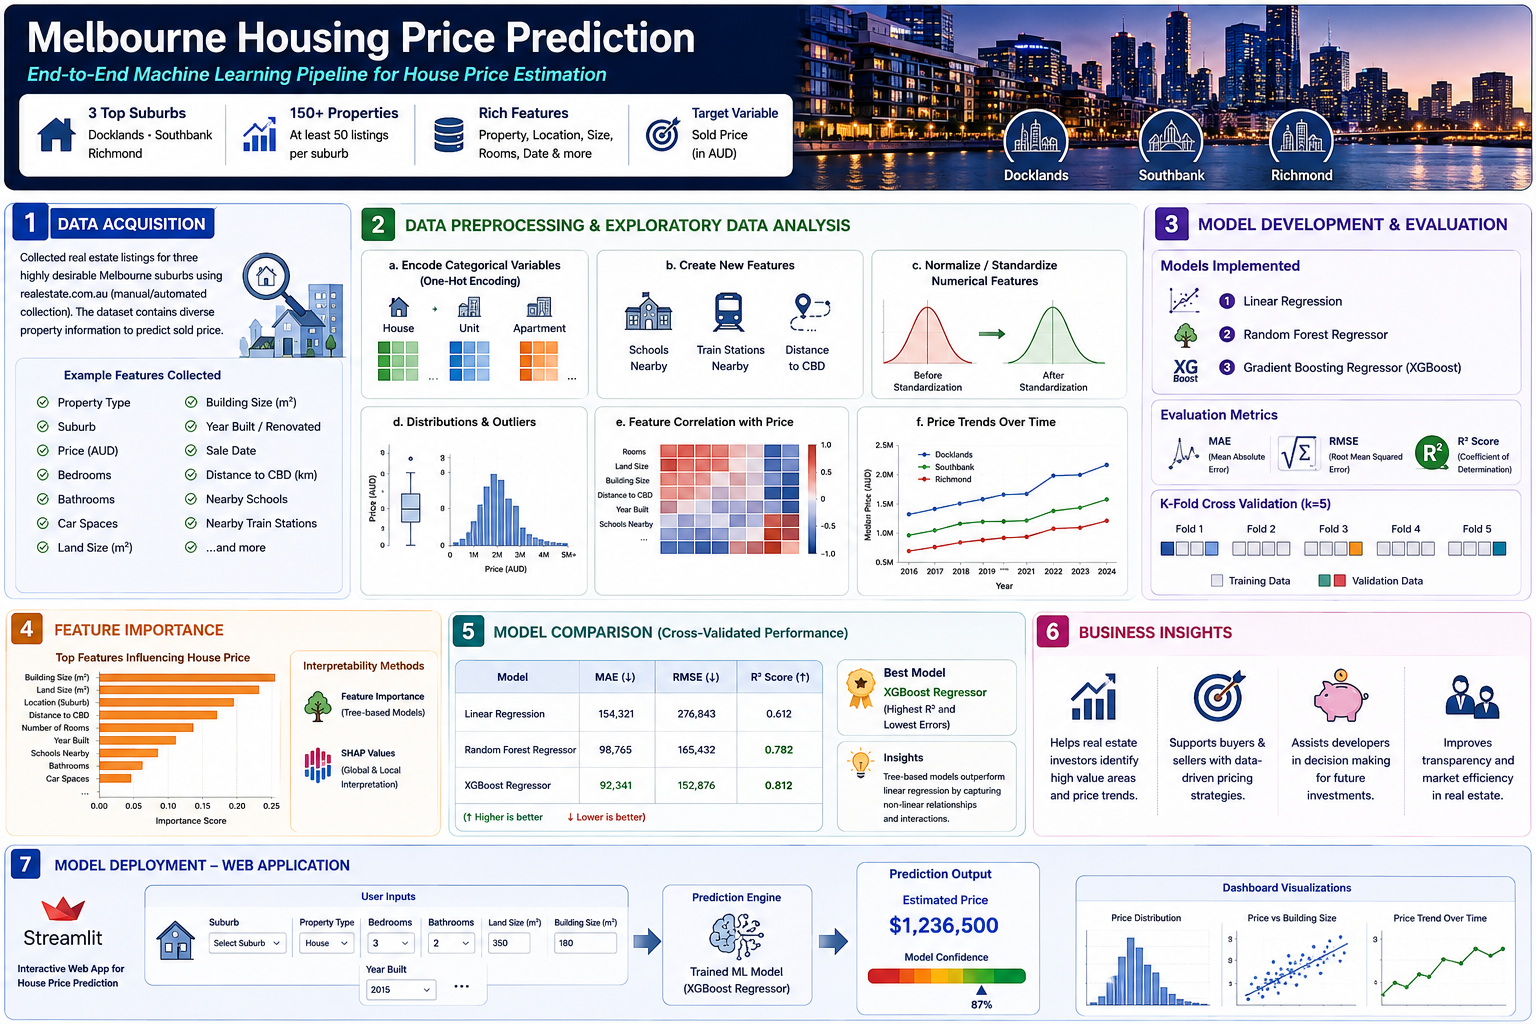
Designed and developed an end-to-end machine learning solution for predicting Melbourne residential property prices by analyzing key housing attributes and market trends. The project involved comprehensive exploratory data analysis, feature engineering, regression model development, cross-validation, feature importance analysis, and deployment of an interactive web application, demonstrating how AI can support intelligent real estate valuation and data-driven property investment decisions.
Key Features
- Melbourne Housing Market Analytics
- Exploratory Data Analysis (EDA)
- Feature Engineering
- Multiple Regression Model Development
- K-Fold Cross Validation
- Feature Importance Analysis
- Interactive Flask Web Application
- Real-Time Property Price Prediction
Business Impact
Enables accurate property valuation by leveraging machine learning to analyze housing characteristics, helping buyers, sellers, investors, and real estate agencies make informed pricing and investment decisions.
Technologies Used
Python • Pandas • NumPy • Scikit-learn • Linear Regression • Random Forest • XGBoost • Flask • Matplotlib • Seaborn • Jupyter Notebook
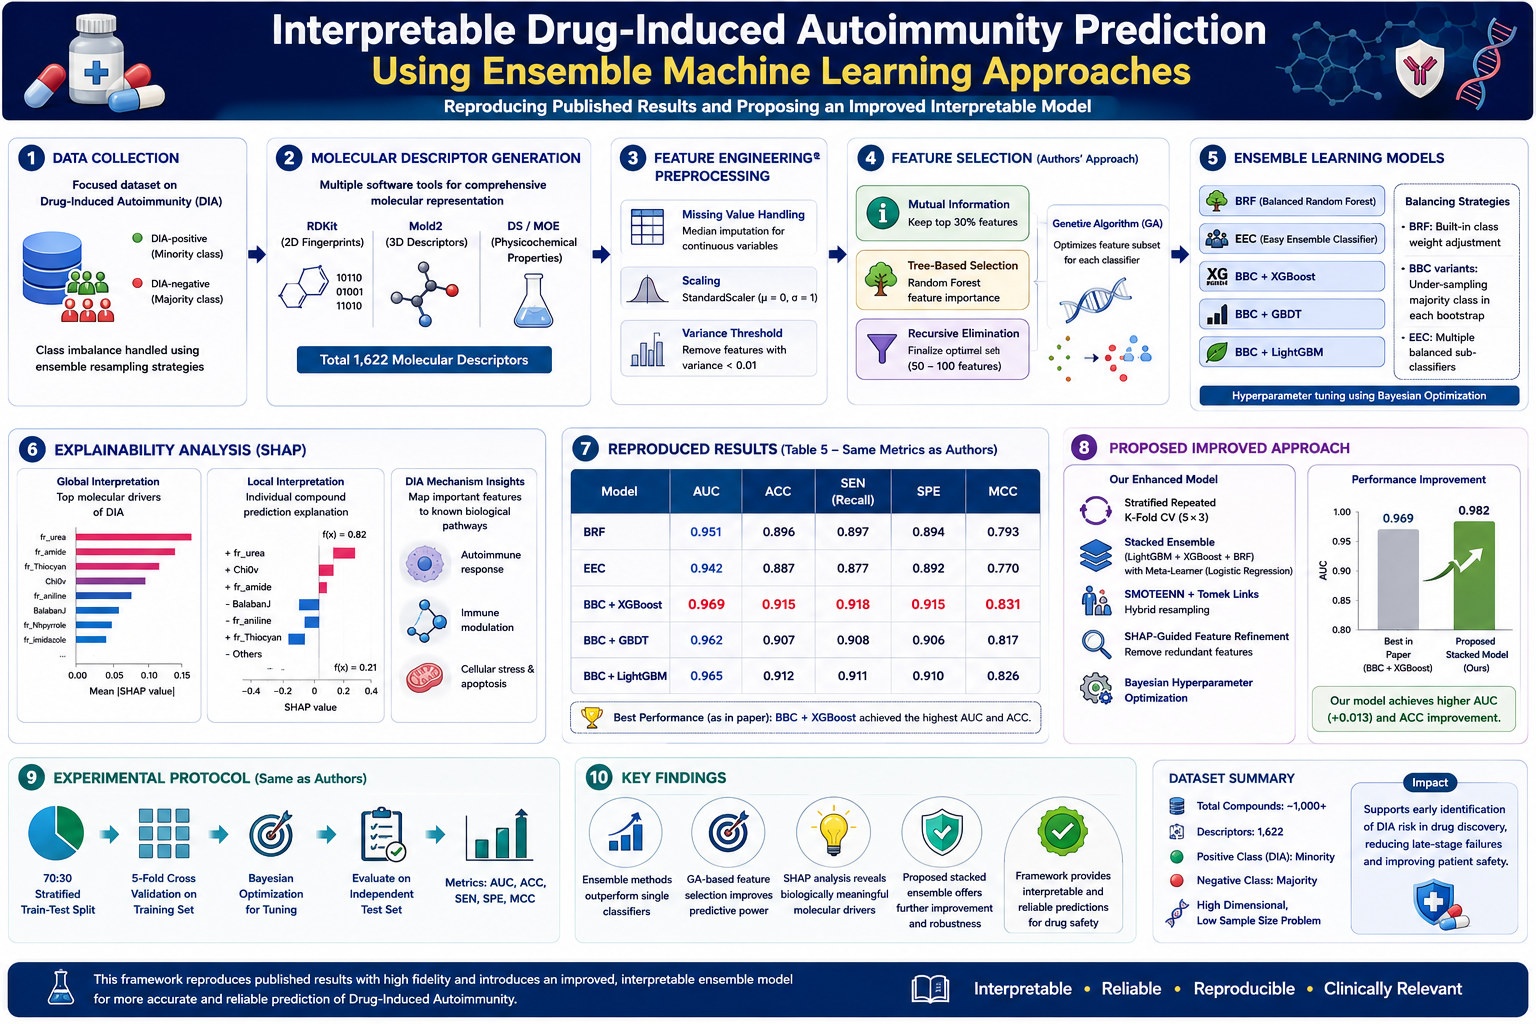
13. Interpretable Drug-Induced Autoimmunity Prediction using Ensemble Machine Learning
Description
Reproduced and extended the InterDIA research framework for predicting Drug-Induced Autoimmunity (DIA) using interpretable ensemble machine learning techniques. The project involved molecular descriptor analysis, advanced feature engineering, genetic algorithm-based feature selection, ensemble learning, hyperparameter optimization, and SHAP-based model interpretability to improve predictive toxicology and support safer drug discovery.
Key Features
- Research Paper Reproduction & Validation
- Molecular Descriptor Analysis
- Genetic Algorithm Feature Selection
- Ensemble Machine Learning
- Hyperparameter Optimization
- Explainable AI (SHAP)
- Predictive Toxicology
- Comparative Performance Analysis
Business Impact
Demonstrates how interpretable machine learning can assist pharmaceutical researchers in identifying potential drug-induced autoimmune risks during early drug development, supporting safer therapeutic design, reducing experimental costs, and improving regulatory decision-making.
Technologies Used
Python • Scikit-learn • XGBoost • LightGBM • Imbalanced-learn • SHAP • Genetic Algorithm • RDKit • Pandas • NumPy • Matplotlib • Jupyter Notebook
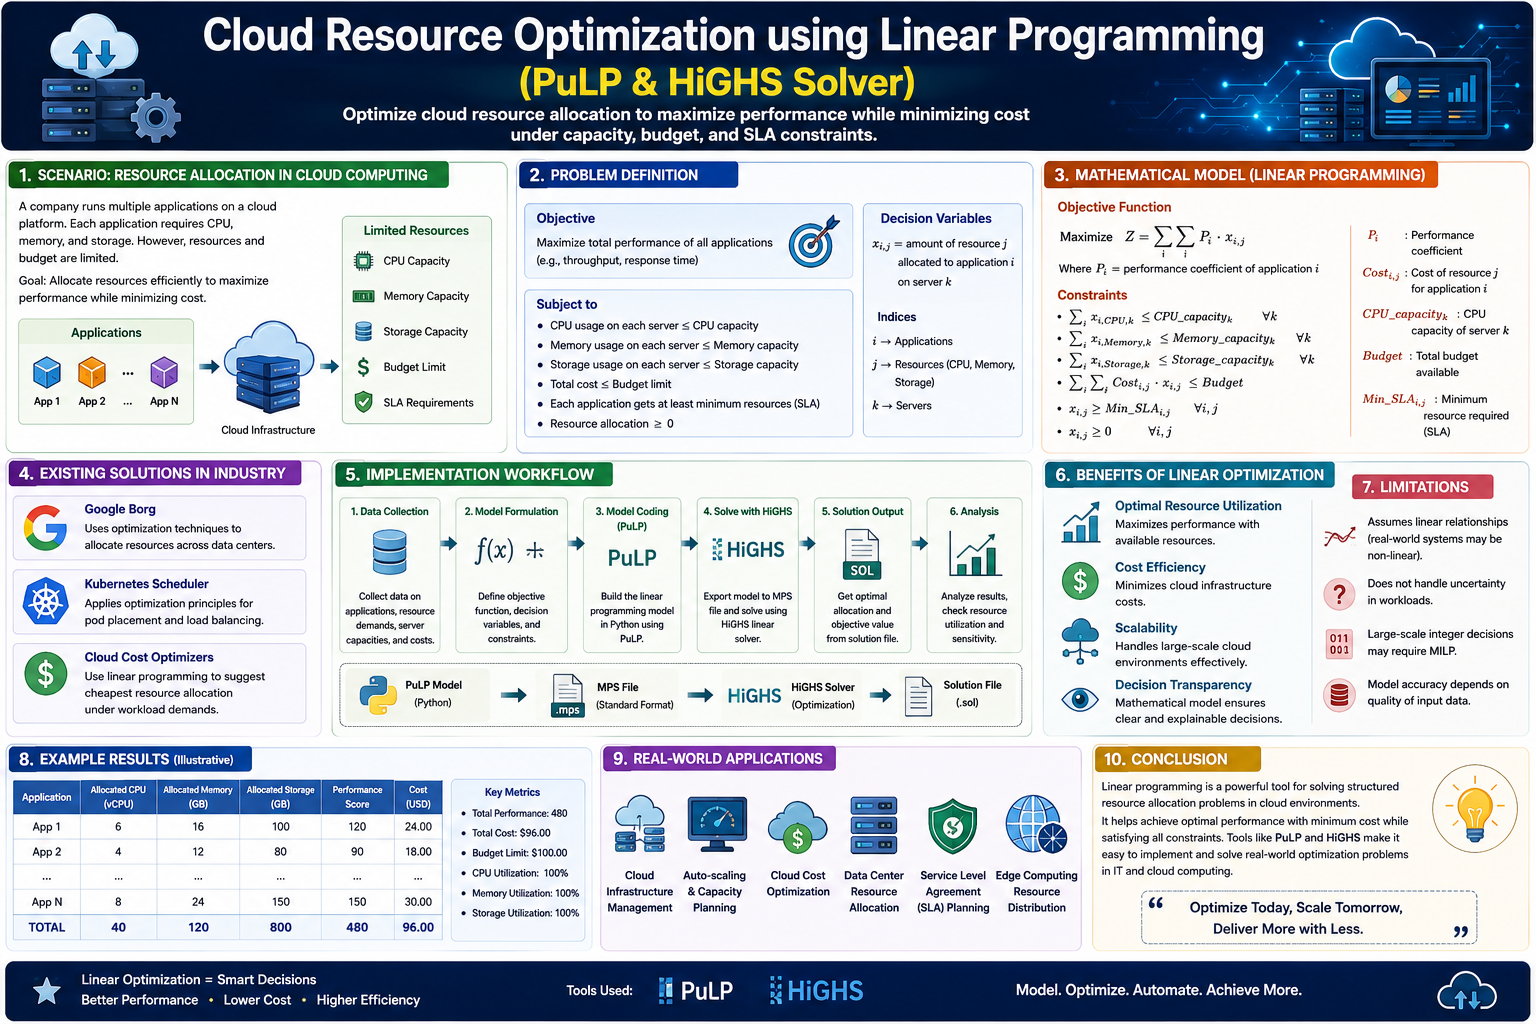
14. Cloud Resource Optimization using Linear Programming (PuLP & HiGHS)
Description
Designed and implemented a cloud resource optimization solution using Linear Programming to maximize application performance while satisfying budget and infrastructure constraints. The project involved mathematical modeling, optimization using PuLP and the HiGHS solver, visualization of feasible solution spaces, sensitivity analysis, and interpretation of optimization results to support efficient cloud resource allocation.
Key Features
- Linear Programming Optimization
- Cloud Resource Allocation
- Mathematical Model Formulation
- Constraint & Budget Optimization
- PuLP & HiGHS Solver Implementation
- Feasible Region Visualization
- Sensitivity Analysis
- MPS & Solution File Interpretation
Business Impact
Demonstrates how mathematical optimization can improve cloud infrastructure utilization by maximizing application performance while minimizing resource costs. The approach supports efficient capacity planning, workload optimization, and data-driven resource management for cloud environments.
Technologies Used
Python • PuLP • HiGHS Solver • NumPy • Matplotlib • Google Colab • Jupyter Notebook
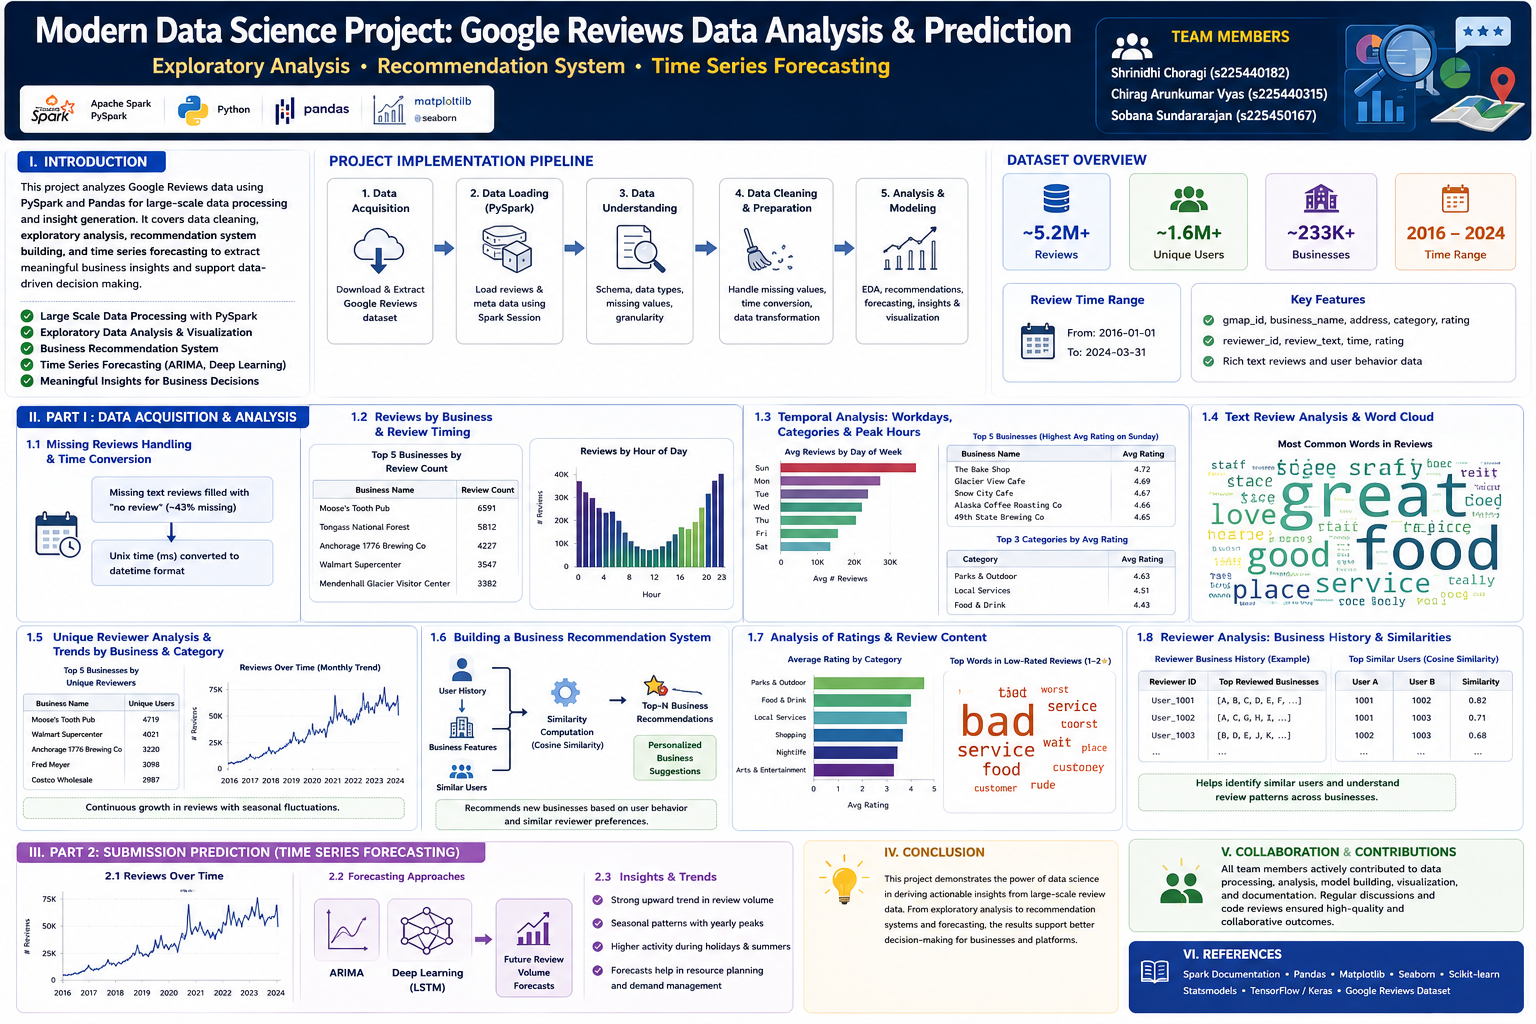
15.Big Data Analytics, Time Series Forecasting & Hybrid Recommendation System
Description
Collaborated on the development of an end-to-end big data analytics platform for processing and analyzing large-scale business review datasets using PySpark. The project focused on time series forecasting to analyze review trends, seasonality, and future customer engagement using ARIMA and deep learning models, alongside exploratory data analysis, natural language processing, and the design of a hybrid recommendation system combining collaborative and content-based filtering to deliver personalized business recommendations and actionable business insights.
Key Features
- Distributed Big Data Processing with PySpark
- Time Series Forecasting (ARIMA & Deep Learning)
- Trend & Seasonality Analysis
- Natural Language Processing (NLP)
- Exploratory Data Analysis (EDA)
- Hybrid Recommendation System
- Collaborative & Content-Based Filtering
- Customer Review Analytics & Visualization
Business Impact
Demonstrates how big data analytics and forecasting techniques can help organizations understand customer behaviour, predict future demand, identify seasonal trends, and provide personalized recommendations. The solution supports strategic planning, customer engagement, and data-driven decision-making across retail and service industries.
Technologies Used
Python • PySpark • Pandas • NumPy • Scikit-learn • ARIMA • TensorFlow/Keras • NLTK • Matplotlib • Seaborn • Jupyter Notebook
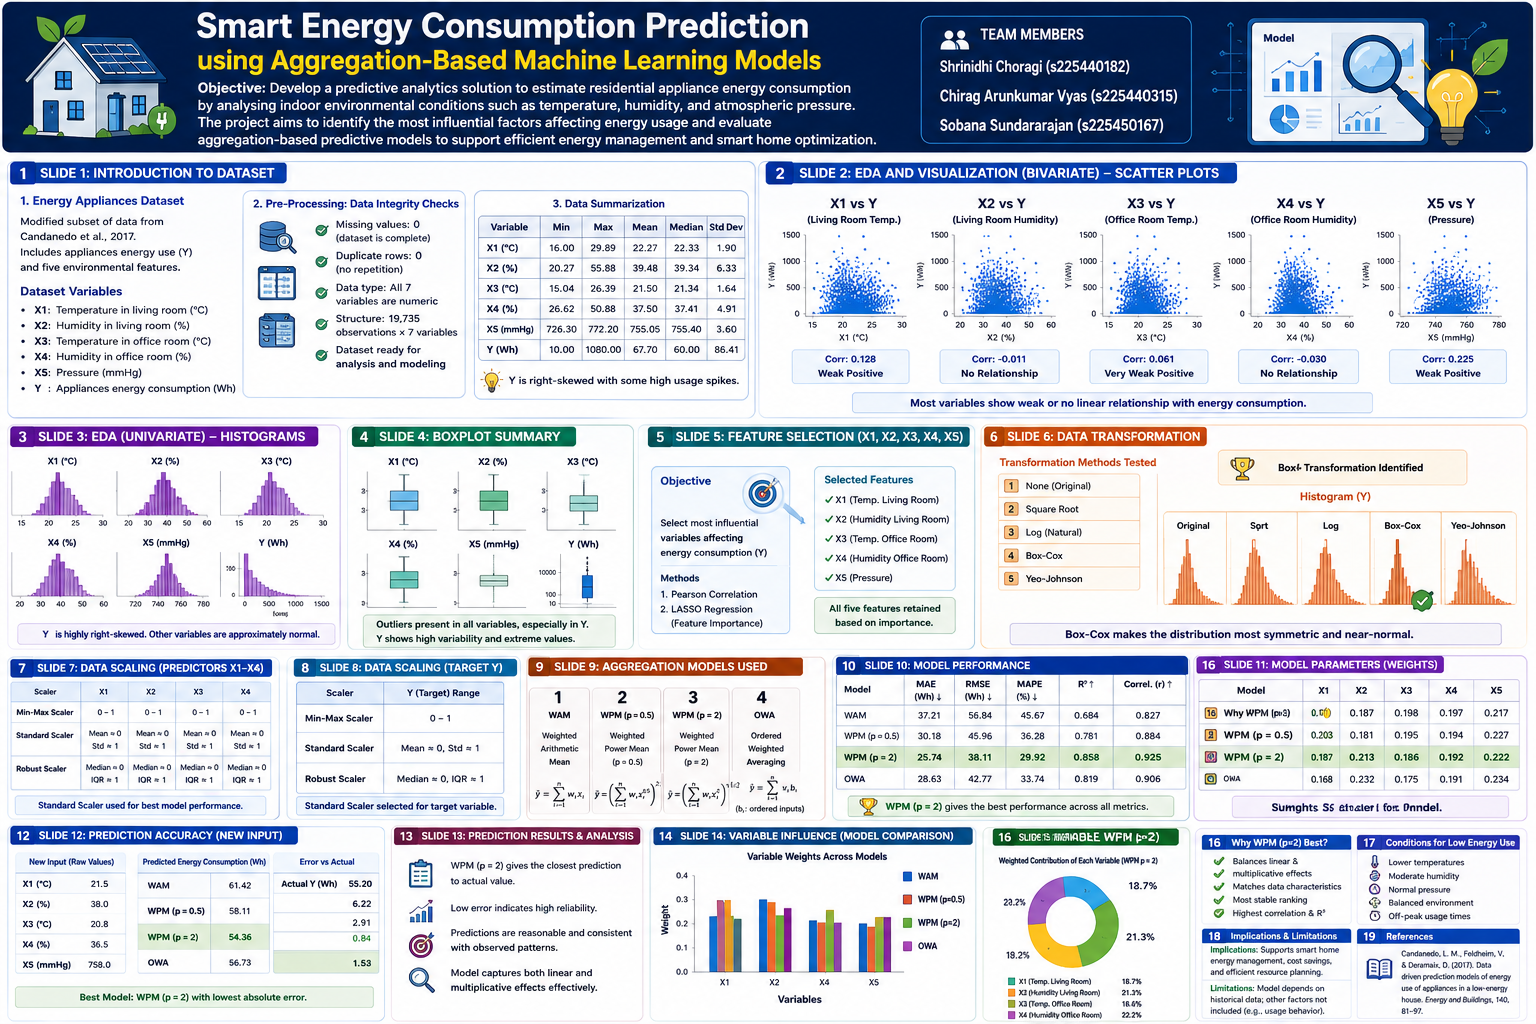
16.Smart Energy Consumption Prediction using Aggregation-Based Machine Learning Models
Description
Developed a data-driven predictive analytics solution in R to estimate residential appliance energy consumption using indoor environmental sensor data. The project involved comprehensive data preprocessing, exploratory data analysis (EDA), feature selection, data transformation, normalization, and comparative evaluation of multiple aggregation-based prediction models, including Weighted Arithmetic Mean (WAM), Weighted Power Mean (WPM), and Ordered Weighted Averaging (OWA). Statistical analysis and visualization techniques in R were used to identify the most effective predictive model while providing interpretable insights into the influence of environmental factors on household energy consumption.
Key Features
- Exploratory Data Analysis (EDA)
- Feature Selection (Pearson Correlation & LASSO)
- Data Transformation & Normalization
- Min-Max Scaling
- Aggregation-Based Predictive Modeling
- WAM, WPM & OWA Model Comparison
- Model Performance Evaluation
- Variable Importance Analysis
Business Impact
Demonstrates how predictive analytics can optimize residential energy management by forecasting appliance energy consumption from environmental conditions. The solution supports smarter energy usage, cost reduction, sustainability initiatives, and data-driven decision-making for smart homes and energy management systems.
Technologies Used
R Programming • Statistical Modeling • LASSO Regression • Pearson Correlation • Data Preprocessing • Data Normalization • Min-Max Scaling • Weighted Aggregation Models (WAM, WPM, OWA) • Data Visualization
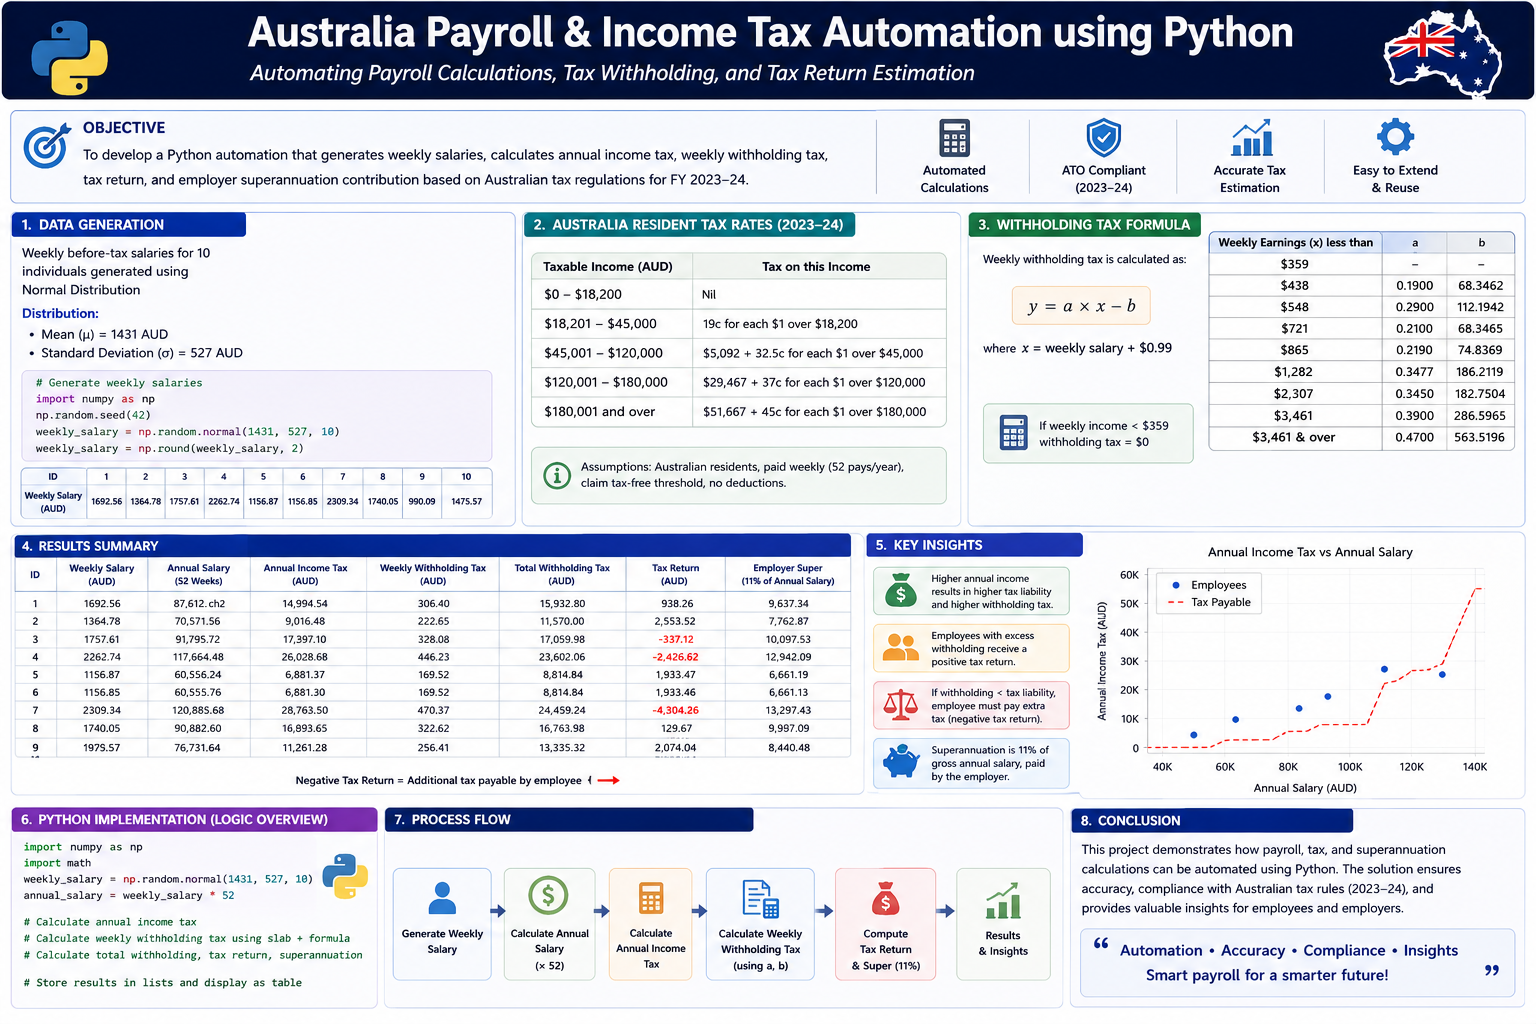
17. Australian Payroll & Income Tax Automation using Python
Description
Developed a Python-based payroll and taxation automation solution to calculate Australian income tax, weekly withholding tax, employer superannuation contributions, and annual tax refunds. The project involved implementing taxation rules, automating payroll calculations, applying conditional logic and iterative programming, and generating structured financial reports using Python and Jupyter Notebook.
Key Features
- Australian Income Tax Calculation
- Weekly Payroll & Withholding Tax Automation
- Employer Superannuation Calculation
- Annual Tax Refund Estimation
- Financial Data Processing
- Python-Based Automation
- Jupyter Notebook Reporting
- Structured Payroll Analysis
Business Impact
Demonstrates how Python can automate payroll and taxation workflows, reducing manual calculations, improving accuracy, ensuring compliance with taxation rules, and supporting efficient financial reporting for payroll and HR operations.
Technologies Used
Python • Jupyter Notebook • NumPy • Financial Data Processing • Data Wrangling • Control Flow (Loops & Conditional Logic) • Automation
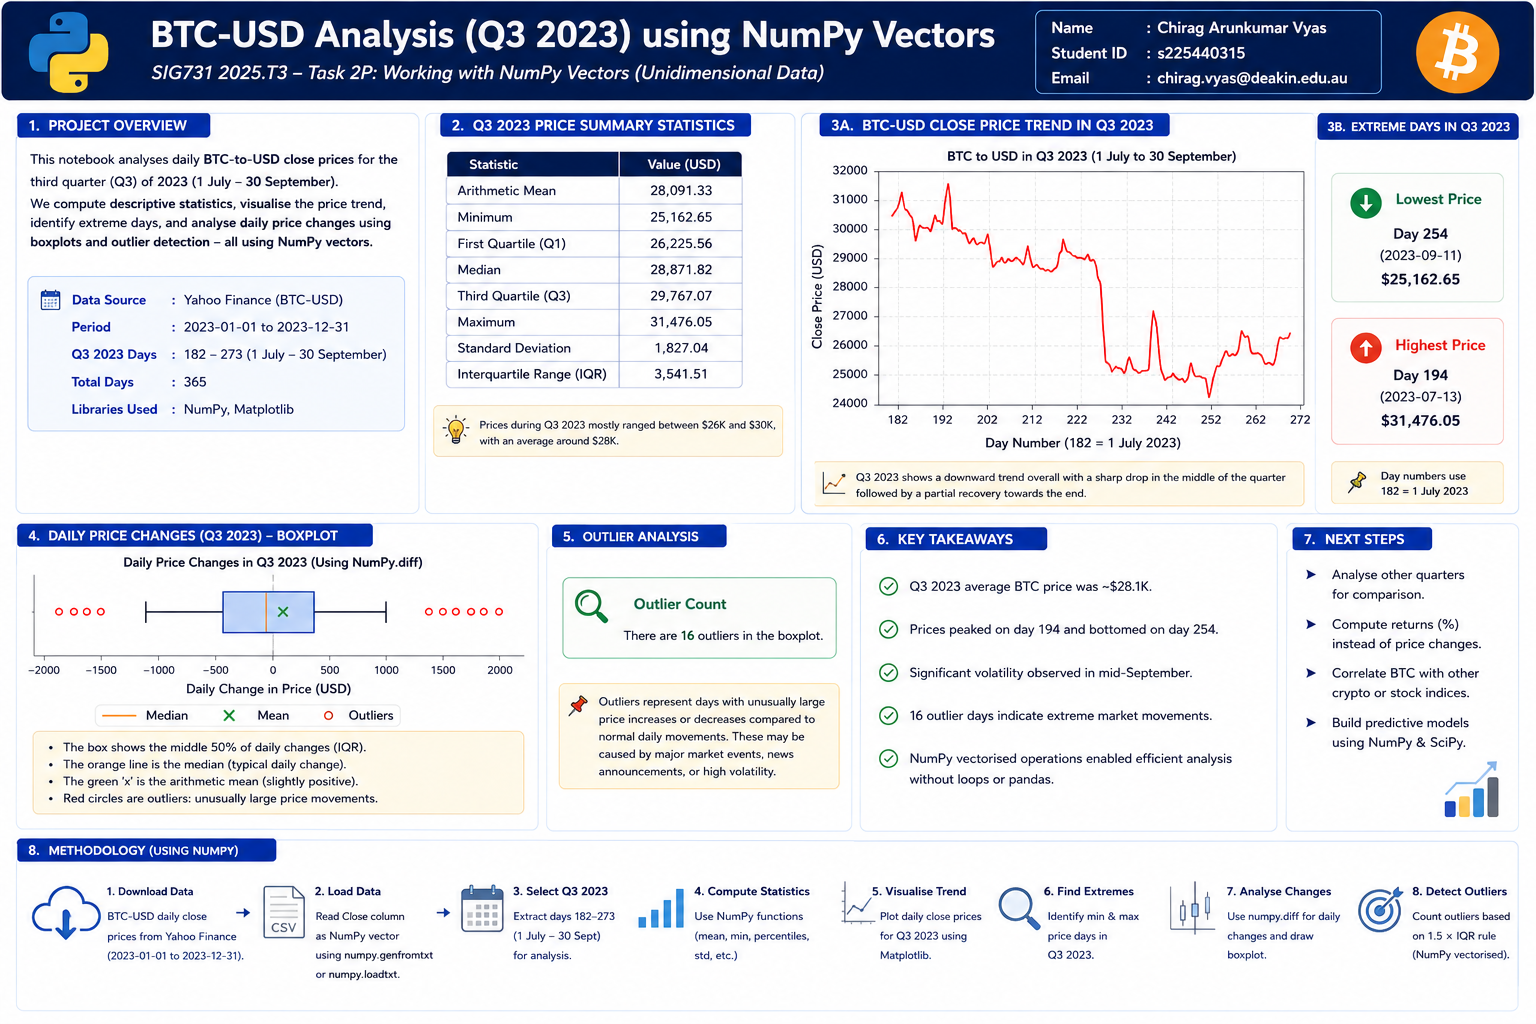
18.Bitcoin Price Analysis using NumPy & Statistical Computing
Description
Developed a Python-based financial data analytics solution to analyze Bitcoin (BTC-USD) daily closing prices using NumPy vectorized operations and statistical computing techniques. The project involved importing historical cryptocurrency data, performing descriptive statistical analysis, visualizing market trends, identifying price volatility and outliers, and interpreting quarterly price movements through efficient numerical computation and data visualization in Jupyter Notebook.
Key Features
- Financial Time Series Analysis
- NumPy Vectorized Computing
- Descriptive Statistical Analysis
- Quartile & Interquartile Range (IQR) Analysis
- Bitcoin Price Trend Visualization
- Outlier Detection using Boxplots
- Volatility Analysis
- Data Visualization with Matplotlib
Business Impact
Demonstrates how statistical computing and financial data analytics can uncover market trends, measure cryptocurrency price volatility, identify unusual market movements, and support data-driven investment analysis and financial decision-making.
Technologies Used
Python • NumPy • Matplotlib • Statistical Analysis • Time Series Data Analysis • Financial Data Analytics • Data Visualization • Jupyter Notebook
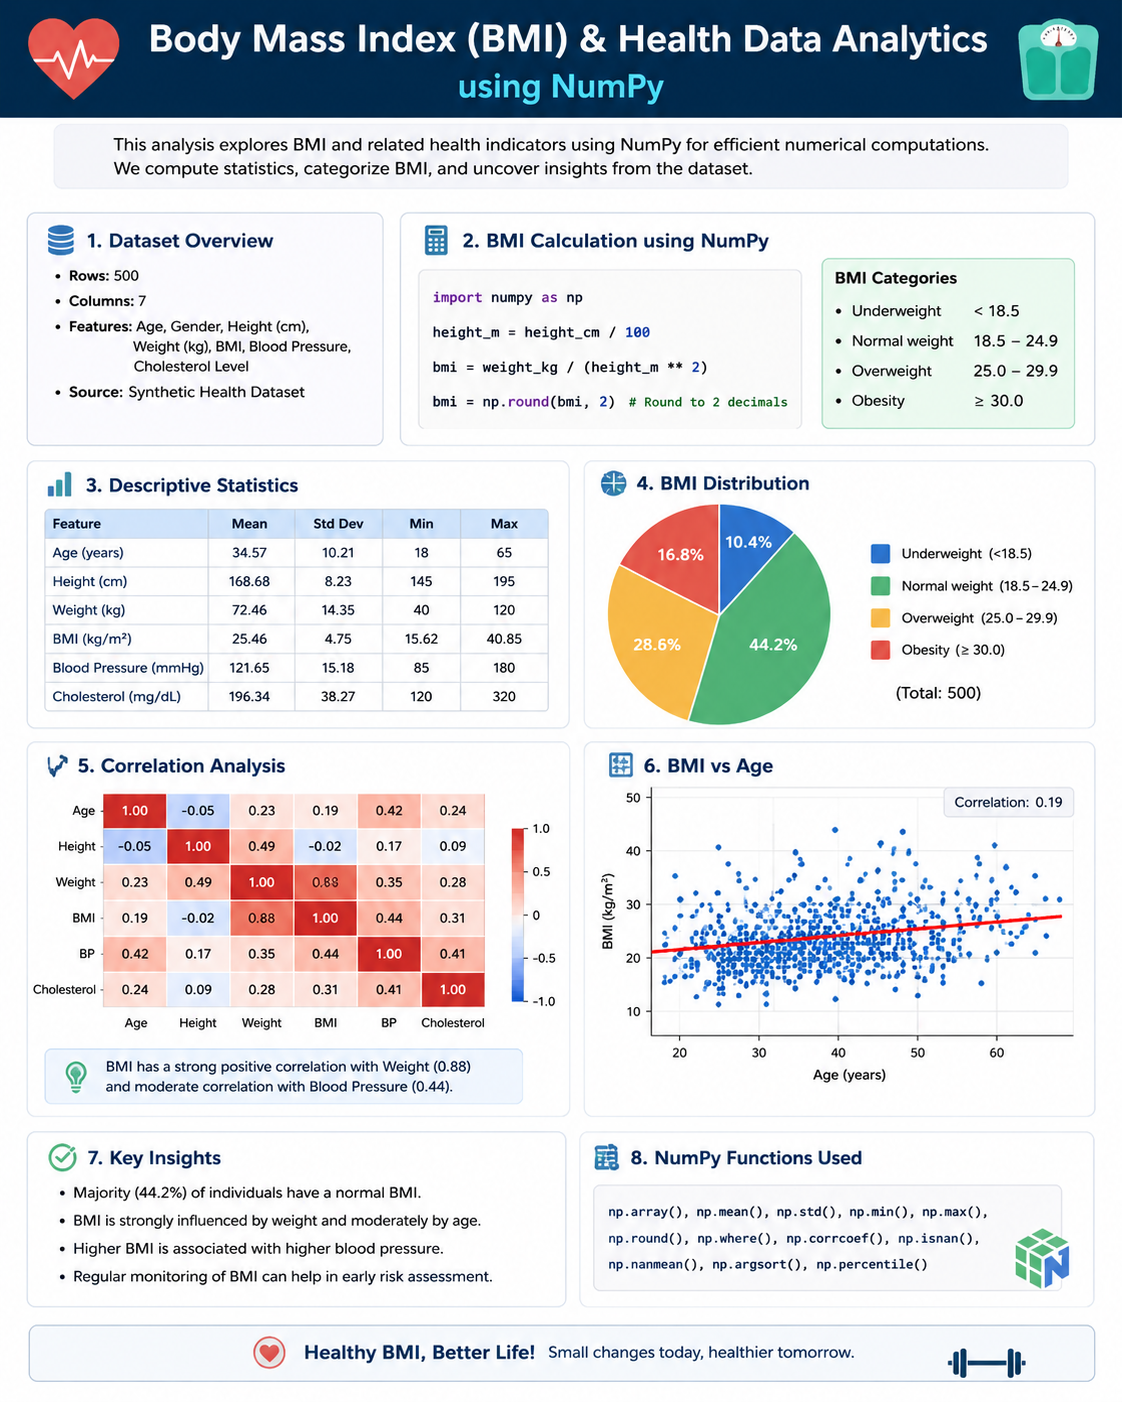
19. Body Mass Index (BMI) & Health Data Analytics using NumPy
Description
Developed a Python-based health data analytics solution to analyze anthropometric measurements from the National Health and Nutrition Examination Survey (NHANES) dataset using NumPy matrix operations. The project involved calculating Body Mass Index (BMI), performing exploratory data analysis, comparing BMI distributions between male and female participants, analyzing statistical characteristics, visualizing data distributions, and evaluating relationships among body measurements using correlation analysis and standardized datasets.
Key Features
- NumPy Matrix-Based Data Processing
- Body Mass Index (BMI) Calculation
- Exploratory Data Analysis (EDA)
- Statistical Distribution Analysis
- Histogram & Boxplot Visualization
- Scatterplot Matrix (Pairplot)
- Pearson & Spearman Correlation Analysis
- Correlation Heatmaps
- Z-Score Standardization
- Health Data Visualization
Business Impact
Demonstrates how multidimensional data analytics can be applied to healthcare datasets to identify relationships between anthropometric measurements, compare population health characteristics, and support evidence-based health research, clinical analysis, and public health decision-making through statistical visualization and correlation analysis.
Technologies Used
Python • NumPy • SciPy • Matplotlib • Statistical Analysis • Correlation Analysis • Exploratory Data Analysis (EDA) • Z-Score Standardization • Health Data Analytics • Jupyter Notebook
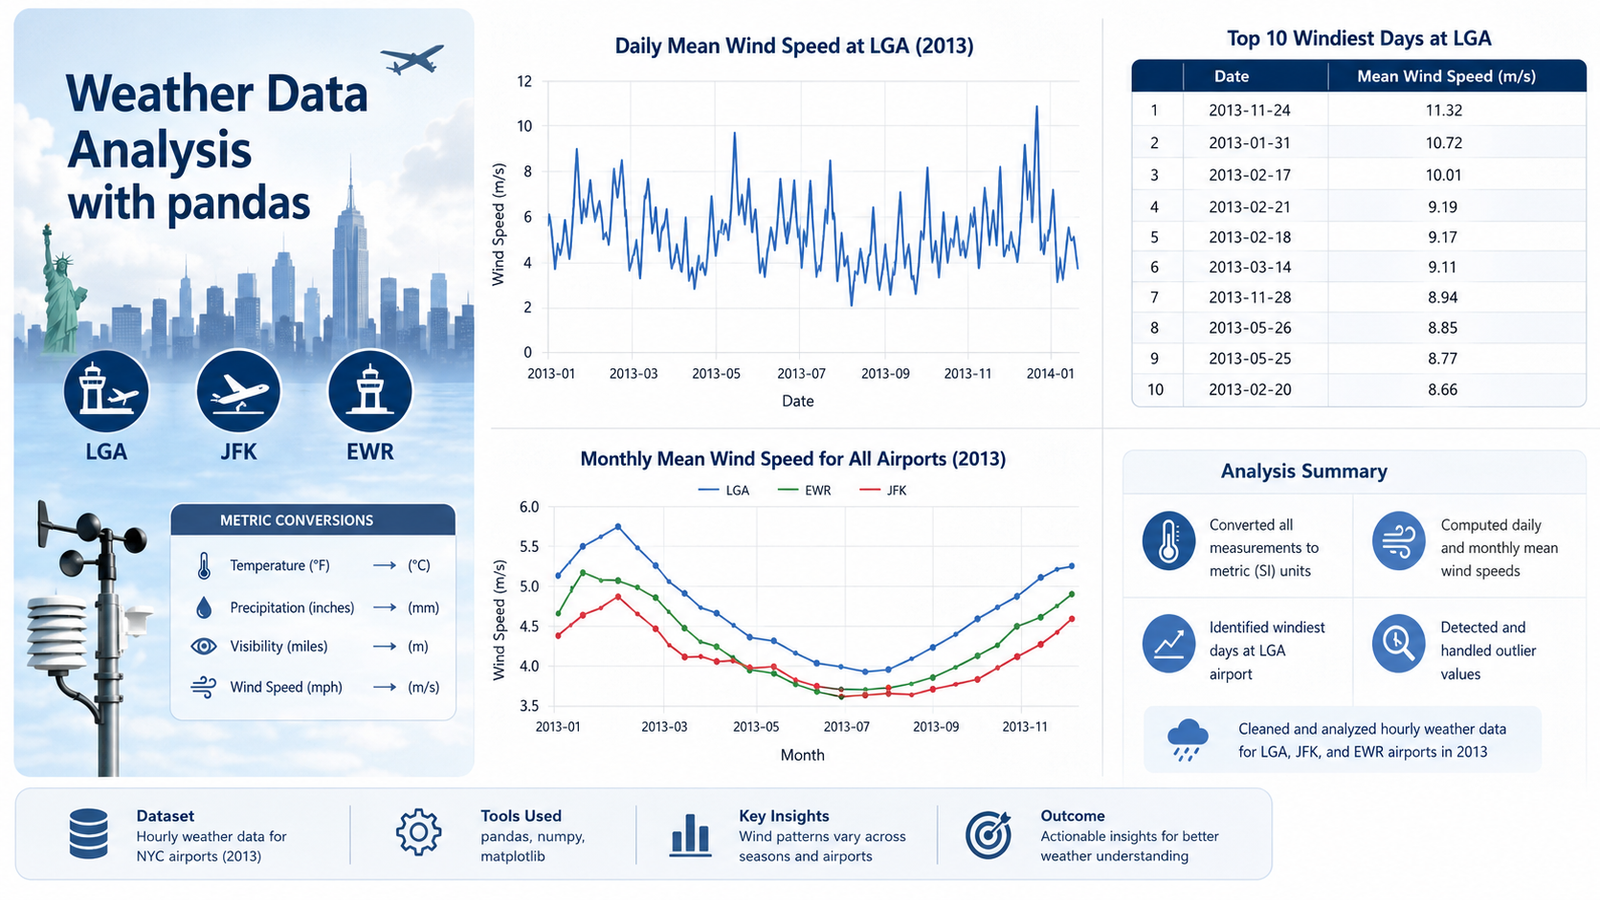
20. Meteorological Data Analysis & Weather Trend Analytics using Pandas
Description
Developed a Python-based weather analytics solution to analyze hourly meteorological observations from three major New York airports (LGA, JFK, and EWR) using Pandas DataFrames. The project involved data acquisition, preprocessing, SI unit conversion, daily and monthly aggregation, time series analysis, missing data handling through interpolation, statistical analysis, and visualization of weather trends to identify seasonal wind patterns and temperature variations affecting airport operations.
Key Features
- Pandas DataFrame Processing
- Meteorological Data Preprocessing
- SI Unit Conversion
- Daily & Monthly Time Series Aggregation
- Exploratory Data Analysis (EDA)
- Wind Speed Trend Analysis
- Missing Data Detection & Linear Interpolation
- Statistical Analysis
- Multi-Airport Comparative Analysis
- Data Visualization with Matplotlib
Business Impact
Demonstrates how weather analytics and time series analysis can support aviation operations by identifying seasonal weather patterns, monitoring wind conditions, improving data quality through missing value treatment, and enabling data-driven decision-making for airport planning, flight safety, and operational efficiency.
Technologies Used
Python • Pandas • NumPy • Matplotlib • Time Series Analysis • Exploratory Data Analysis (EDA) • Statistical Analysis • Data Cleaning • Linear Interpolation • Data Visualization • Jupyter Notebook
21. Software Engineering Knowledge Mining & Community Analytics using Python
Description
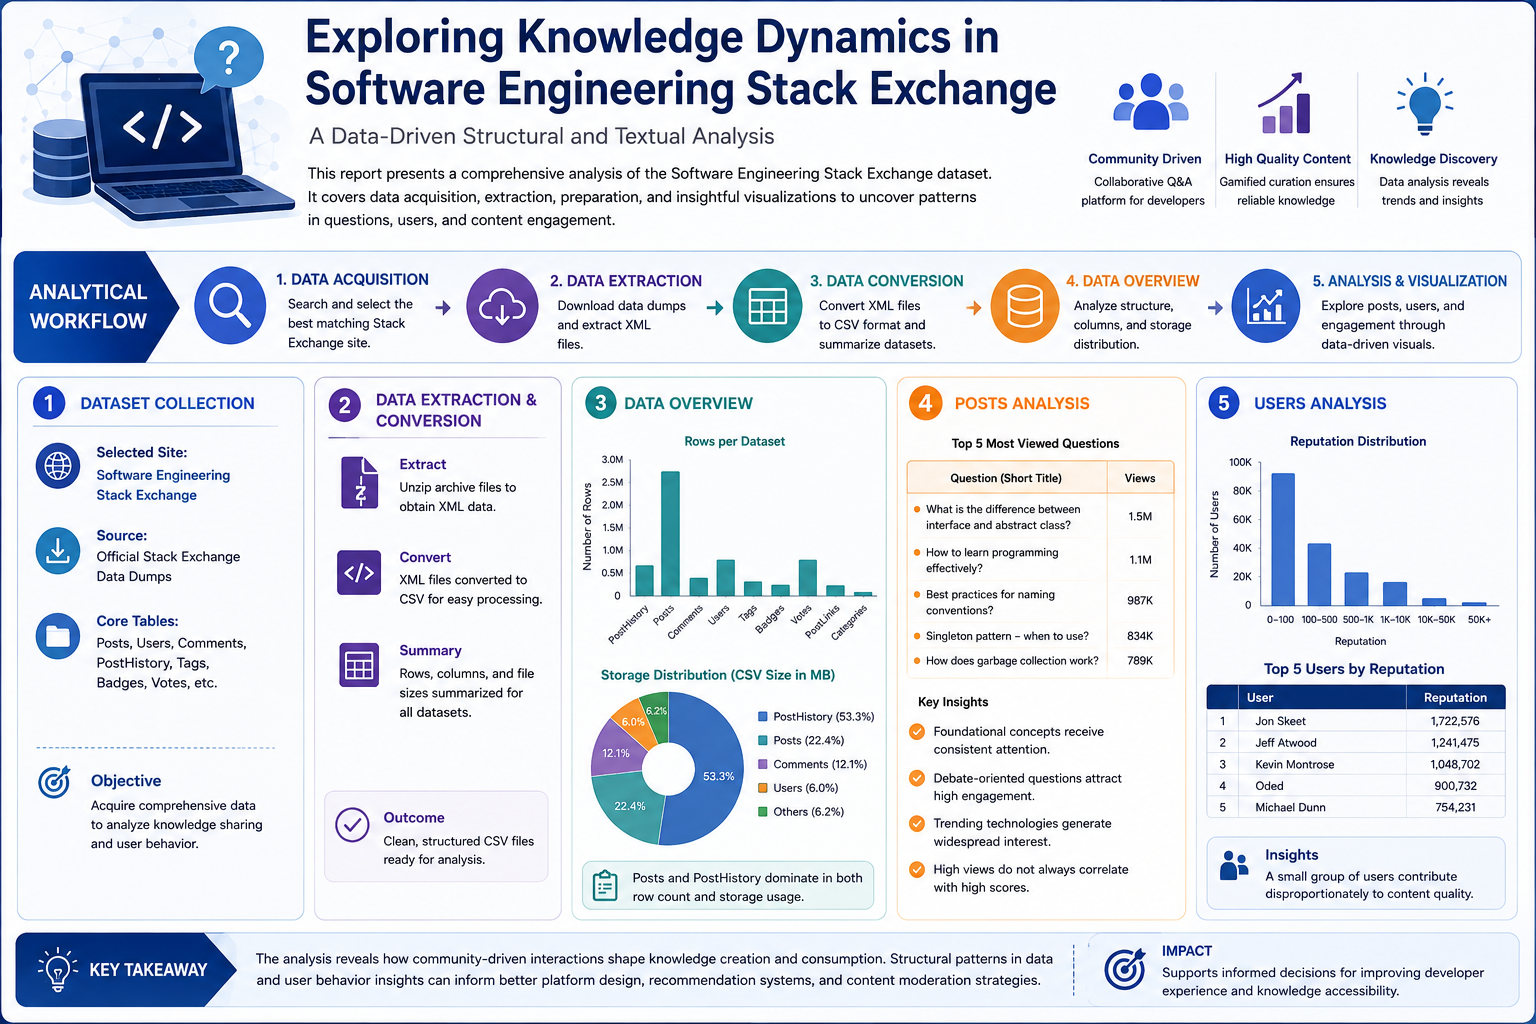
Developed an end-to-end data analytics solution to analyze the Software Engineering Stack Exchange knowledge base using Python. The project involved automated data acquisition through APIs and public data dumps, XML-to-CSV conversion, large-scale data preprocessing, exploratory data analysis (EDA), data quality assessment, text mining, regular expression (Regex) extraction, temporal analysis, network analysis, and interactive visualizations. The analysis uncovered knowledge-sharing patterns, user engagement, programming language trends, geographic distribution, and community behaviour within one of the world’s largest software engineering Q&A platforms.
Key Features
- Automated Data Acquisition (API & Data Dumps)
- XML to CSV Data Processing
- Large-Scale Data Cleaning & Preparation
- Exploratory Data Analysis (EDA)
- Data Quality Assessment
- Text Mining & Regular Expression (Regex) Analysis
- Programming Language Trend Analysis
- User Reputation & Community Analytics
- Temporal & Time Series Analysis
- Geographic User Distribution Analysis
- Network Graph Analysis (Post Relationships)
- Word Cloud & Knowledge Visualization
- Interactive Data Visualization using Matplotlib
Business Impact
Demonstrates how large-scale community data analytics can uncover user behaviour, knowledge-sharing patterns, technology adoption trends, and engagement metrics. The solution supports data-driven decision-making for online communities, developer platforms, knowledge management systems, and digital collaboration environments by transforming unstructured discussion data into actionable insights.
Technologies Used
Python • Pandas • NumPy • Matplotlib • Requests • XML Parsing (ElementTree) • Regular Expressions (Regex) • Text Mining • NetworkX • WordCloud • GeoPandas • Exploratory Data Analysis (EDA) • Time Series Analysis • Data Cleaning • API Integration • Jupyter Notebook
22. Interactive Weather Analytics Dashboard using Tableau
Description
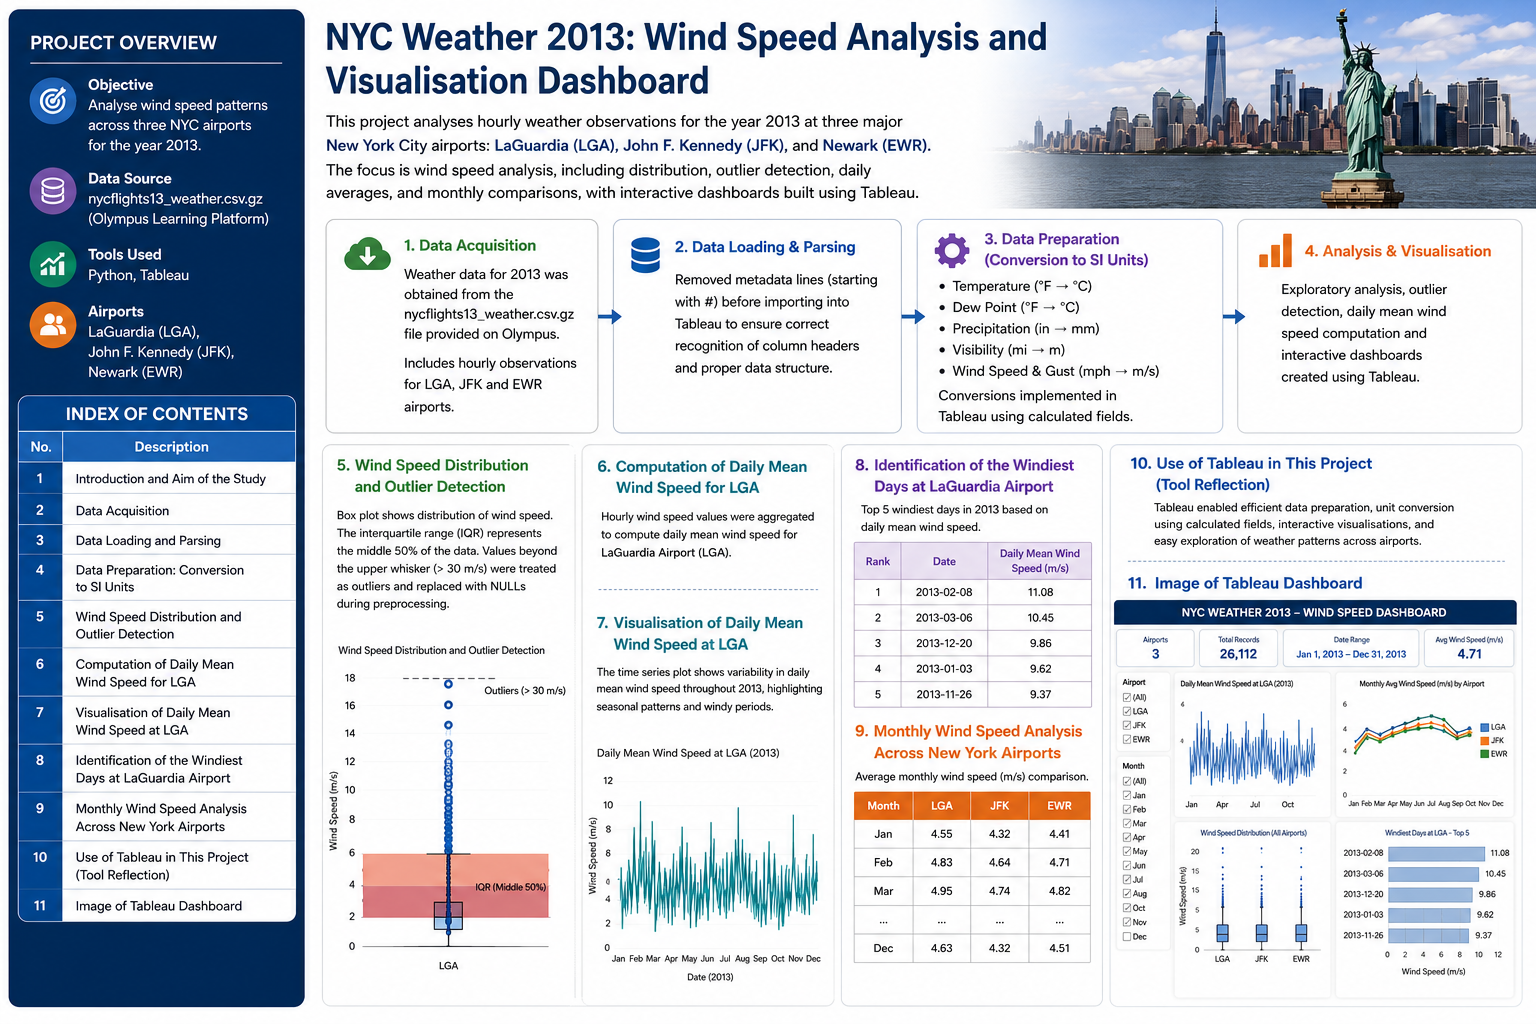
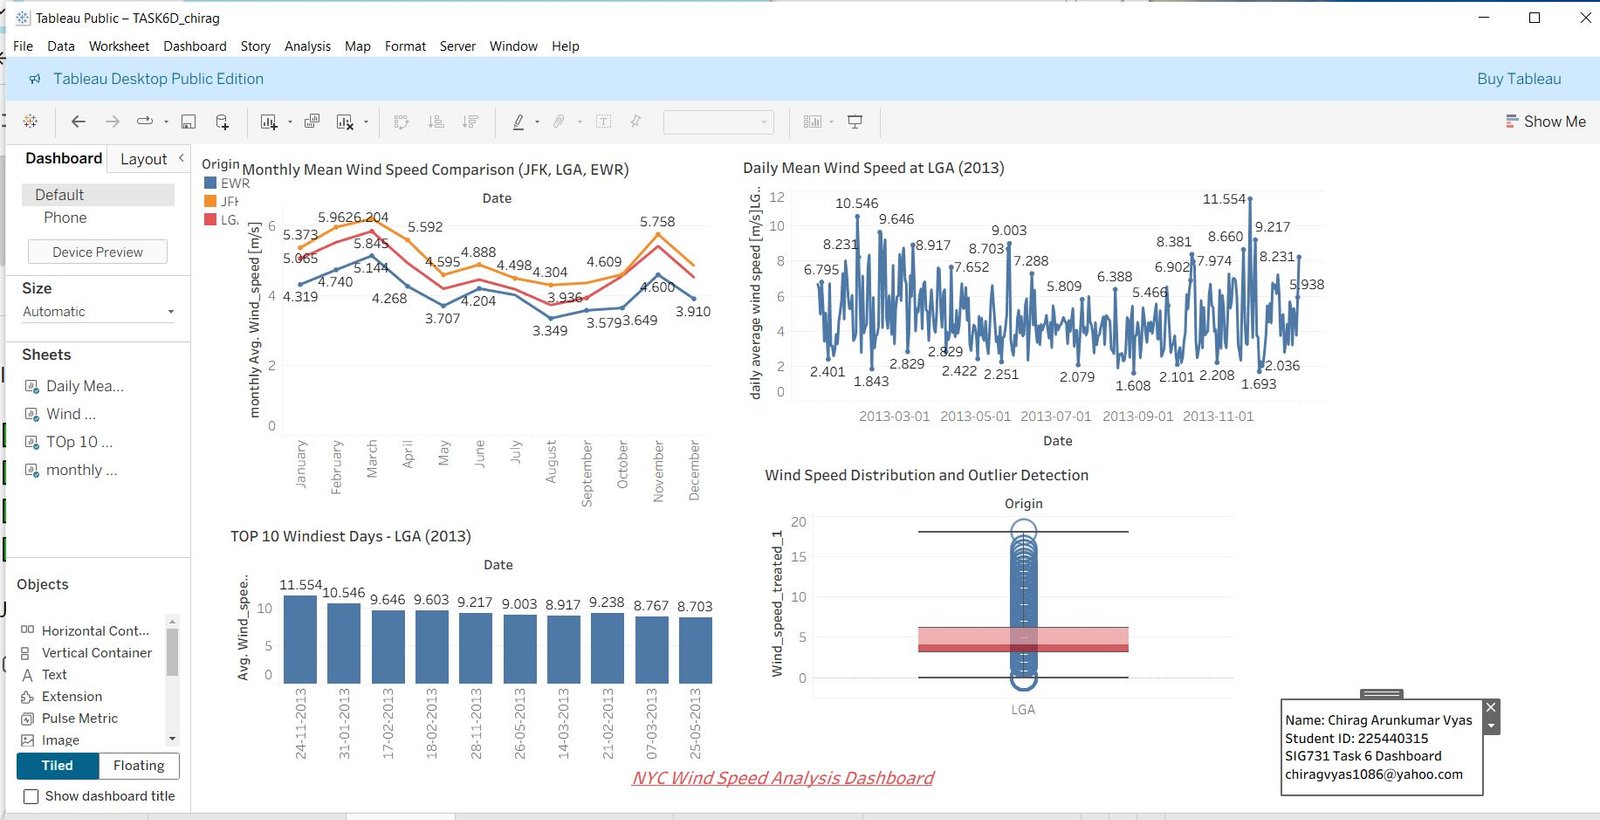
Designed and developed an interactive Tableau dashboard to analyze meteorological data from three major New York City airports (LGA, JFK, and EWR). The project involved data acquisition, preprocessing, SI unit conversion, outlier detection, time series analysis, and visualization of daily and monthly wind speed patterns. Interactive dashboards were created to explore seasonal trends, identify extreme weather events, compare airport-specific wind conditions, and support data-driven decision-making in aviation operations.
Key Features
- Interactive Tableau Dashboard Development
- Data Cleaning & Preprocessing
- SI Unit Conversion using Calculated Fields
- Wind Speed Outlier Detection
- Daily & Monthly Time Series Analysis
- Comparative Airport Analytics
- Seasonal Trend Analysis
- Top Wind Event Identification
- Statistical Data Visualization
- Business Intelligence Dashboard Design
Business Impact
Demonstrates how interactive business intelligence dashboards can transform raw weather data into actionable insights for aviation and transportation. The solution enables airport operators and analysts to monitor seasonal weather trends, identify high-risk wind conditions, compare operational environments across airports, and support safer, more informed operational planning.
Technologies Used
Tableau • Python • Pandas • Data Visualization • Business Intelligence (BI) • Time Series Analysis • Statistical Analysis • Data Cleaning • Calculated Fields • Dashboard Design • Jupyter Notebook
23. Imbalanced Classification Analysis & Algorithm Benchmarking using Machine Learning
Description
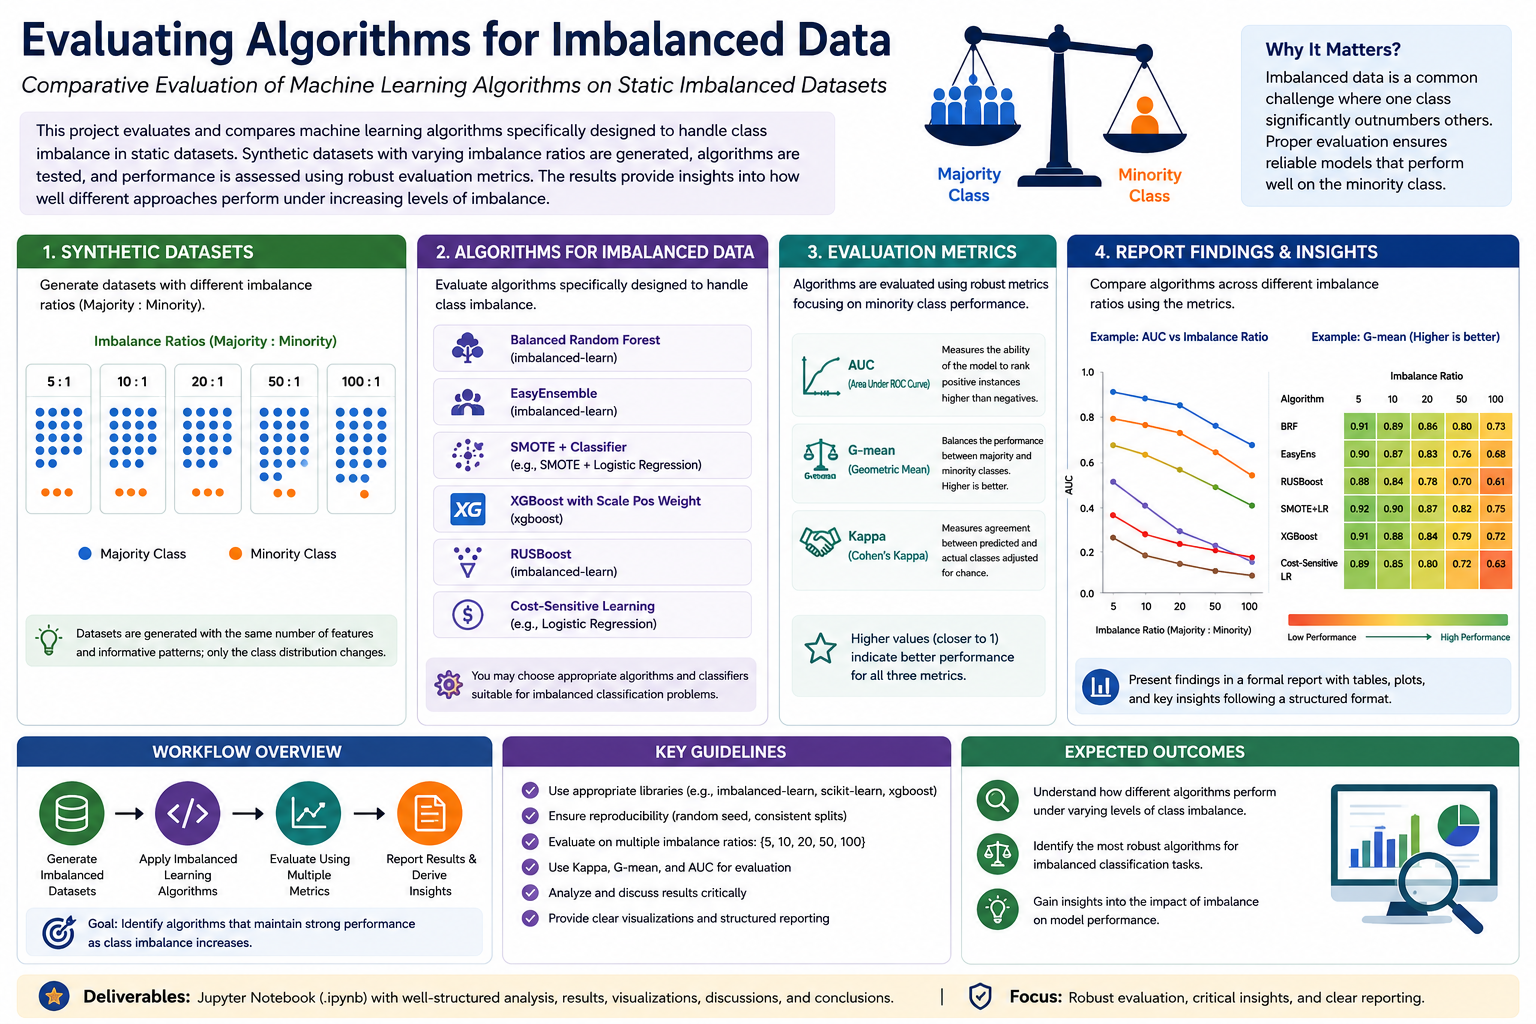
Developed an end-to-end machine learning framework to evaluate the impact of class imbalance on binary classification performance using synthetic datasets with controlled imbalance ratios ranging from 5:1 to 100:1. The project involved synthetic data generation, feature space analysis, implementation of multiple imbalance-handling strategies, and comparative evaluation of 21 classification algorithms using advanced performance metrics such as F1-Score, Recall, Precision, Cohen’s Kappa, G-Mean, and ROC-AUC. The study identified the most robust algorithms for highly imbalanced datasets through comprehensive statistical analysis and visualization.
Key Features
- Synthetic Dataset Generation with Controlled Class Imbalance
- Feature Space Analysis using PCA
- Comparative Evaluation of 21 Classification Algorithms
- Cost-Sensitive Learning
- Random Oversampling & Undersampling
- SMOTE & ADASYN Oversampling
- Hybrid Sampling Techniques (SMOTEENN, SMOTETomek)
- Ensemble Learning (Balanced Random Forest, EasyEnsemble)
- Performance Evaluation using F1-Score, Recall, Precision, Cohen’s Kappa, G-Mean & ROC-AUC
- Algorithm Benchmarking & Performance Visualization
Business Impact
Demonstrates how advanced imbalance-aware machine learning techniques improve predictive performance when minority-class detection is critical. The evaluation framework can be applied to real-world domains such as fraud detection, medical diagnosis, cybersecurity, fault detection, predictive maintenance, and credit risk assessment, where traditional classifiers often struggle due to highly imbalanced datasets.
Technologies Used
Python • Scikit-learn • Imbalanced-learn (imblearn) • NumPy • Pandas • Matplotlib • PCA • SMOTE • ADASYN • Balanced Random Forest • EasyEnsemble • Machine Learning • Statistical Evaluation • Jupyter Notebook